Date:Fri Apr 19 2024Tokyo:3:29Sydney:4:29New York:14:29London:19:29CET:20:29
BinaryOptions.net Forums› Binary Options Strategy
Options
Taking Trades on the Spur of the Moment
mifune Posts: 160 ✭✭
Posts: 160 ✭✭
I've spoken in the past about the importance of planning trades in advance, and it's one of the main fundamentals behind how I like to trade. First I look for support and resistance in the market – which can come from price history (i.e., the candlestick formations plotted in the recent past), pivot points, or Fibonacci levels (although I haven't really used Fibs recently with binary options).
Second, I consider trend, as in the current day's trend, how a pair might be leaning due to news events or how national economies might be trending currently, and trend on a larger timescale, by looking past several days, weeks, or months. For instance, in the current oil market or the recent EUR/USD tailspin, put options look very attractive due to the highly bearish trending that's occurred over the past several months. In cases like this, I prefer to bias my trading in terms of trend direction. In flat, non-trending markets, I simply don't have a preference.
And third, I consider how price is acting around support and resistance to determine where to get in and at what price, and I adhere to this. It's a fairly simple strategy and it's worked well for me and something I've been able to refine in my few years of trading, so I continue to plug along doing this. I have points in the market picked out well in advance, have certain “rules” for getting into a trade and don't waver from this, given my belief that a robot-like mental demeanor can certainly be an effective mindset when applied to a trading strategy that genuinely works.
So naturally each trade should be thought of as a business decision and not something that's done viscerally or one that simply came to mind seconds ago. That is, it should ideally be done free of emotion and planned out similar to how a business might coordinate its own ventures.
Nevertheless, once in a while when I'm going from chart to chart looking at the markets for various pairs, I'll see one that looks very good in terms of offering a near-immediate trade setup. This happened to me recently on the GBP/JPY (January 5, 2015).
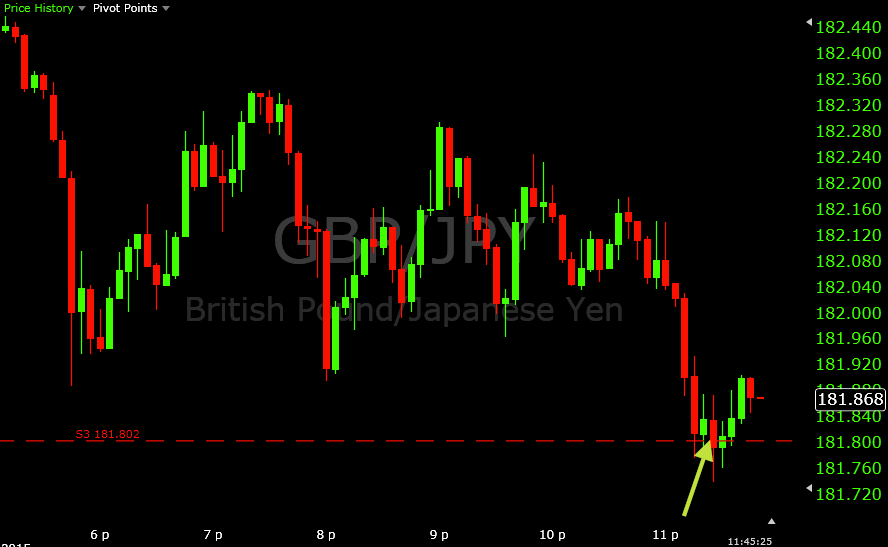
The GBP/JPY had been bearish on this day, falling all the way to its support 3 level. In my experience, both resistance 3 and support 3 – the outermost pivot points – tend to be pretty good trading areas. When price gets to these general price zones, it's indicative that the market has moved a decent distance during that particular day and might have some general tendency to consolidate around this area. That said, I'm not necessarily a believer in “regression to the mean” when it comes to trading or using that as a conceptual basis on which to support trades.
In fact, it's a rather bad way of thinking (“Well, this pair has dropped 80 pips today, it's pretty unlikely that it falls even more.”) It's like believing that a star soccer/football player will score a goal simply because he hasn't scored in eight games, as if he's overdue to resume following his historical statistical goal-scoring trend. Sometimes, the fact that one currency has fallen significantly against another or that a player isn't performing up to par with his expectations has genuine underlying meaning, rather than mere statistical happenstance. Perhaps a nation experiences rueful economic outcomes that consequently affects its currency. And perhaps a player isn't performing well due to underlying injury, age-related decline, or strategic adjustments that negatively affect his ability to be effective. Explaining away disparities by sheer randomness or as a result of statistical flukiness needs to be taken with caution.
Nevertheless, support 3 and resistance 3 pivot points can often be interesting to watch. The market tends to show sensitivity to them. And occasionally to the point where I'm willing to get into a trade.
In this case, I opened this chart right slightly after the 11:15PM (EST) candlestick (which runs from 11:10-11:15) began opening on the GBP/JPY. This candle moved about eight pips ahead of support 3, which was a nice bounce off the level. Although this setup wasn't something that was premeditated in advance, it still fit my main trading criteria (i.e., price acting the way I wanted it to around an important support or resistance level) and was something I would be happy to take should I be able to get another touch of support 3 (181.802). This would provide my preferred entry point, which is extremely vital in short-term trades.
I was able to get a touch of support 3 on the following 11:20 candle. I took a call option just as it touched, and despite a little drama initially (being four pips out-of-the-money), support 3 did hold and I wound up with a 3-4 pip winner.
All in all, the main consideration is that the trades you take have to fit your strategy, or your system if you prefer to call it that. While trading around support and resistance as the foundation will inherently entail planning potential trading areas out in advance, if a trade is setting up before your eyes upon entering a chart and fits the standards you have set for entering into a trade, then it's perfectly acceptable. In that case, I wouldn't refer to it as “trading on the spur of the moment,” but rather being swiftly proactive about taking advantage of a present trading opportunity. They can certainly feel welcome when you might oftentimes go hours without one.
Tagged: