Date:Tue Apr 16 2024Tokyo:19:53Sydney:20:53New York:6:53London:11:53CET:12:53
BinaryOptions.net Forums› Binary Options Strategy
The Very Best and Simple Indicator for a Support/Resistance Based Trading Strategy + Trade Examples
mifune Posts: 160 ✭✭
Posts: 160 ✭✭
"The Power of the Pivot Point"
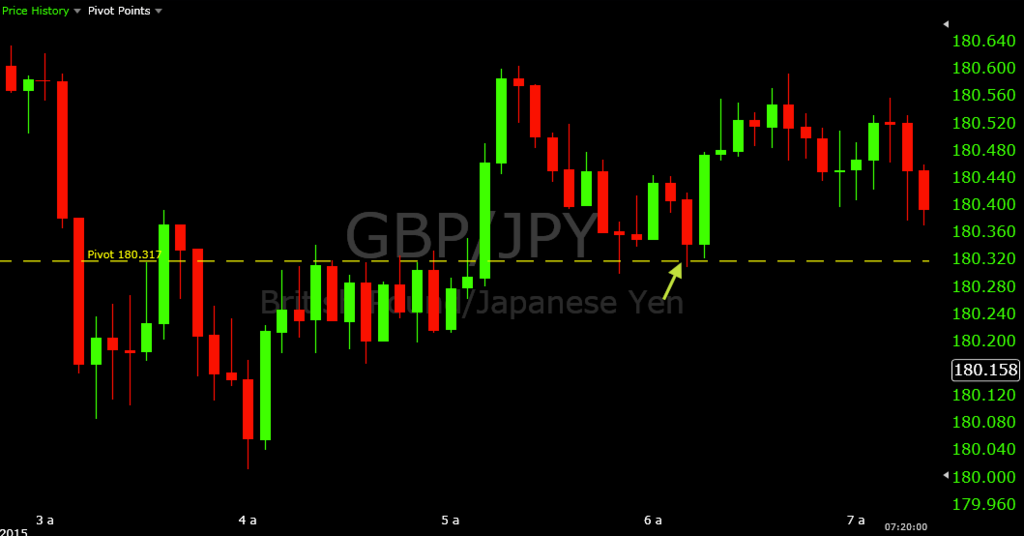
Pivot points are calculated using the open, close, high, and low of the previous day's trading. The most reliable pivot points tend to come from price data using the New York open and close. The daily pivot level – the middle line – is one of the best price levels to follow over the course of a trading day. You will find that price often converges to this level. And when there are patterns in a price chart and reasonable predictions can be made from them, this sets up trading opportunities.
The following are two trades from back in January on GBP/JPY. As you can see from the image, the market started heating up around 3AM EST on this currency pair and went right through the pivot level.
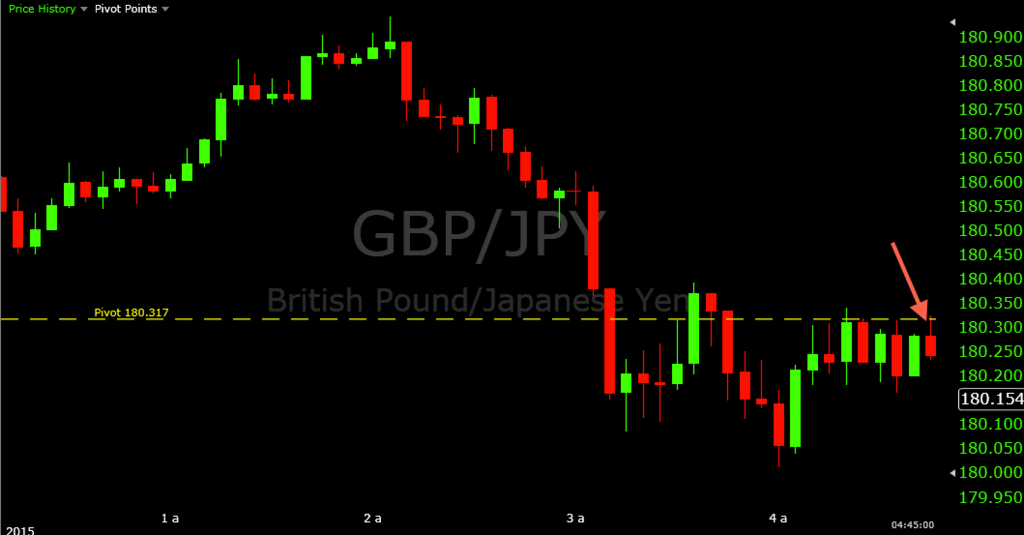
This is fine, as price isn't going to show sensitivity to a pivot point every time. Usually if price isn't showing any care to congest around a price level, I simply ignore it and look for alternative areas to trade. However, that doesn't mean that it can't re-establish itself when the market revisits this level at any point in the future.
On the way back up, price began showing some congestion around this level by forming an upper wick up to the level before falling back below. Price revisited on the following candle and began crowding around the level. After 4AM, we were in a clear downtrend for the morning and there was a touch-and-reject of the 180.317 pivot level. My trading strategy, simply, is to find price levels in the market from pivot points, previous price history (i.e., where price has congested in the past), and Fibonacci levels (though I haven't used these in a while) – and use price action behavior to determine whether trades are worth getting into around these price levels of interest.
On the 4:20 candle (this is a five-minute chart) price touched, rejected, and closed below the pivot level. This signals a potentially good put option trading opportunity for me. 1) The price level is taking an effect on the market; 2) the price action is setting up favorably; and 3) the trend is down in accordance with the intended direction of the trade. When the price went back below the pivot, I was at the point where I was willing to get into this set up at the next touch of the pivot point.
After a near-touch on the 4:35 candle, I was able to get a touch on the 4:45, where I entered a put option on the touch of the level. Price continued to stay around 180.317 for a bit, but it stayed below and I wound up with a winning trade.
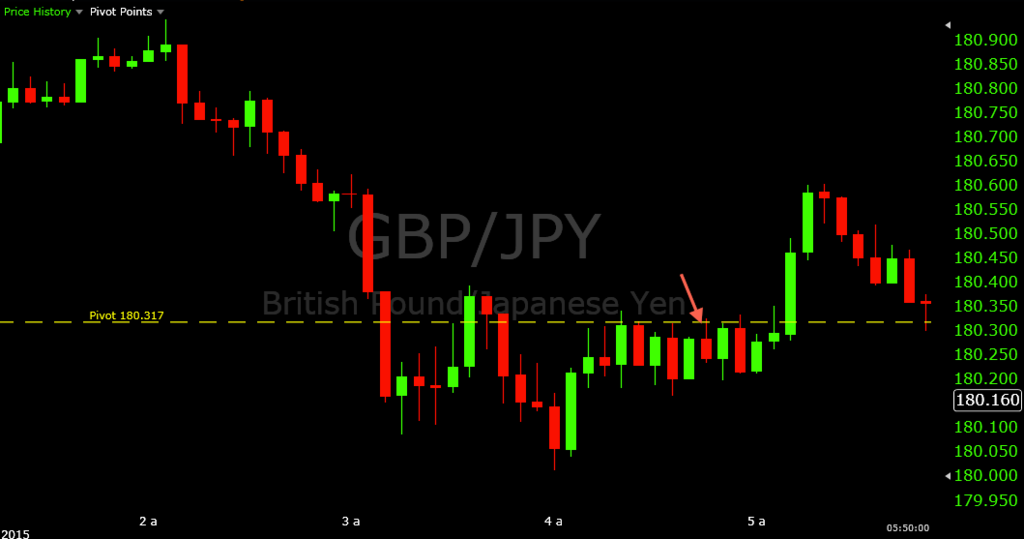
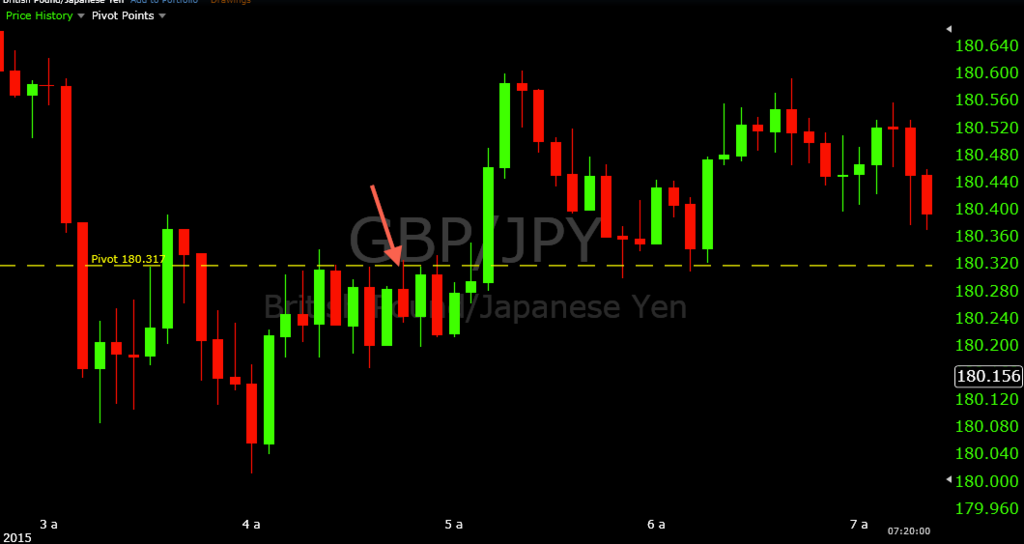
Just after 5AM price rose around thirty pips above pivot, suggesting buyers had taken some level of force over this market after the standstill at pivot.
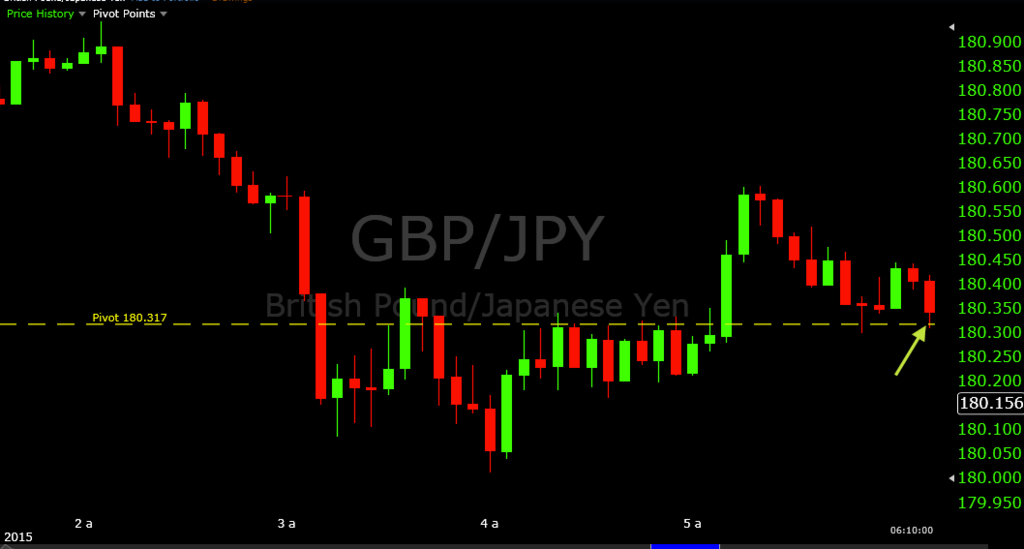
Of course, there's the old motto “old support can turn into new resistance” and vice versa. If trades have set up at a particular level before, the market can be especially prone to doing it again. So when price began falling back down to the pivot I began looking at the 180.317 for call option opportunities. When price bounced off the 5:50 candle, this became the price action confirmation I was looking for. Once price re-tested pivot on the 6:10 candle, I entered into a call option trade and was able to obtain a huge winner of around fifteen pips with only seconds of the trade's duration spent out-of-the-money.
As you can see, pivot points represent a very strong technical indicator that you can place on your charts to give yourself an advantage in finding intraday support and resistance levels. As for my charts, I'm using freestockcharts.com. I really like the simplicity of the platform there. The data feed is very reliable and the pivot points indicator is based on the New York close, which I find to be the most reliable.
Just remember that you can't simply trade a level, however. You need multiple confirmation factors when taking a trade, including evidence from price action and trend, and simple things like staying out of the market before major news events.
Pivot points are calculated using the open, close, high, and low of the previous day's trading. The most reliable pivot points tend to come from price data using the New York open and close. The daily pivot level – the middle line – is one of the best price levels to follow over the course of a trading day. You will find that price often converges to this level. And when there are patterns in a price chart and reasonable predictions can be made from them, this sets up trading opportunities.
The following are two trades from back in January on GBP/JPY. As you can see from the image, the market started heating up around 3AM EST on this currency pair and went right through the pivot level.

This is fine, as price isn't going to show sensitivity to a pivot point every time. Usually if price isn't showing any care to congest around a price level, I simply ignore it and look for alternative areas to trade. However, that doesn't mean that it can't re-establish itself when the market revisits this level at any point in the future.
On the way back up, price began showing some congestion around this level by forming an upper wick up to the level before falling back below. Price revisited on the following candle and began crowding around the level. After 4AM, we were in a clear downtrend for the morning and there was a touch-and-reject of the 180.317 pivot level. My trading strategy, simply, is to find price levels in the market from pivot points, previous price history (i.e., where price has congested in the past), and Fibonacci levels (though I haven't used these in a while) – and use price action behavior to determine whether trades are worth getting into around these price levels of interest.
On the 4:20 candle (this is a five-minute chart) price touched, rejected, and closed below the pivot level. This signals a potentially good put option trading opportunity for me. 1) The price level is taking an effect on the market; 2) the price action is setting up favorably; and 3) the trend is down in accordance with the intended direction of the trade. When the price went back below the pivot, I was at the point where I was willing to get into this set up at the next touch of the pivot point.

After a near-touch on the 4:35 candle, I was able to get a touch on the 4:45, where I entered a put option on the touch of the level. Price continued to stay around 180.317 for a bit, but it stayed below and I wound up with a winning trade.

Just after 5AM price rose around thirty pips above pivot, suggesting buyers had taken some level of force over this market after the standstill at pivot.

Of course, there's the old motto “old support can turn into new resistance” and vice versa. If trades have set up at a particular level before, the market can be especially prone to doing it again. So when price began falling back down to the pivot I began looking at the 180.317 for call option opportunities. When price bounced off the 5:50 candle, this became the price action confirmation I was looking for. Once price re-tested pivot on the 6:10 candle, I entered into a call option trade and was able to obtain a huge winner of around fifteen pips with only seconds of the trade's duration spent out-of-the-money.

As you can see, pivot points represent a very strong technical indicator that you can place on your charts to give yourself an advantage in finding intraday support and resistance levels. As for my charts, I'm using freestockcharts.com. I really like the simplicity of the platform there. The data feed is very reliable and the pivot points indicator is based on the New York close, which I find to be the most reliable.
Just remember that you can't simply trade a level, however. You need multiple confirmation factors when taking a trade, including evidence from price action and trend, and simple things like staying out of the market before major news events.
Tagged: