Mifune's Strategy Thread
Comments
-
Nice mate!
-
Thanks! I wish I had been putting the screenshots directly within the post itself from the beginning.kostasze said:Nice mate!
There was an error rendering this rich post.
-
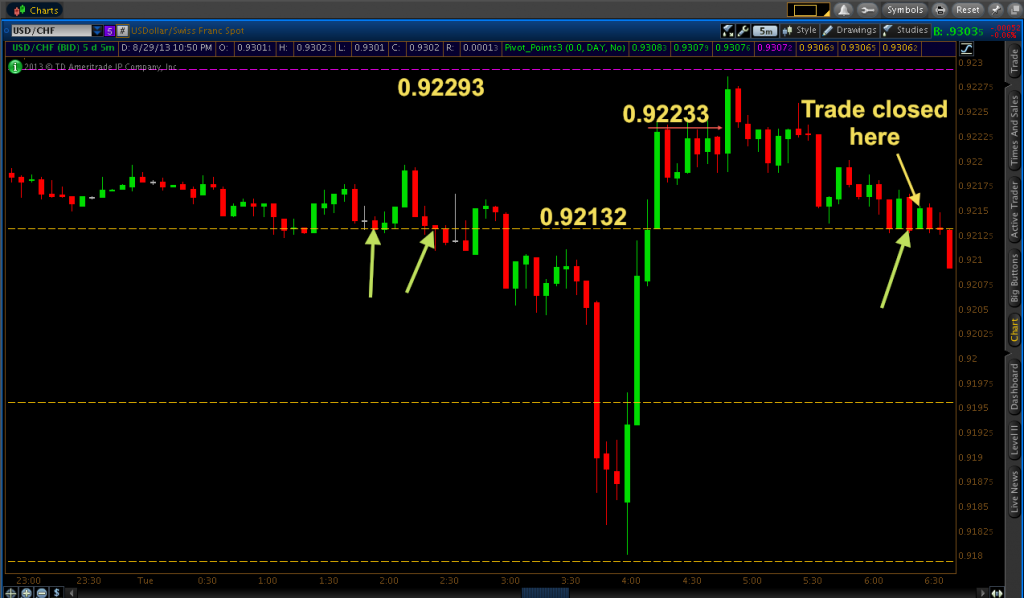
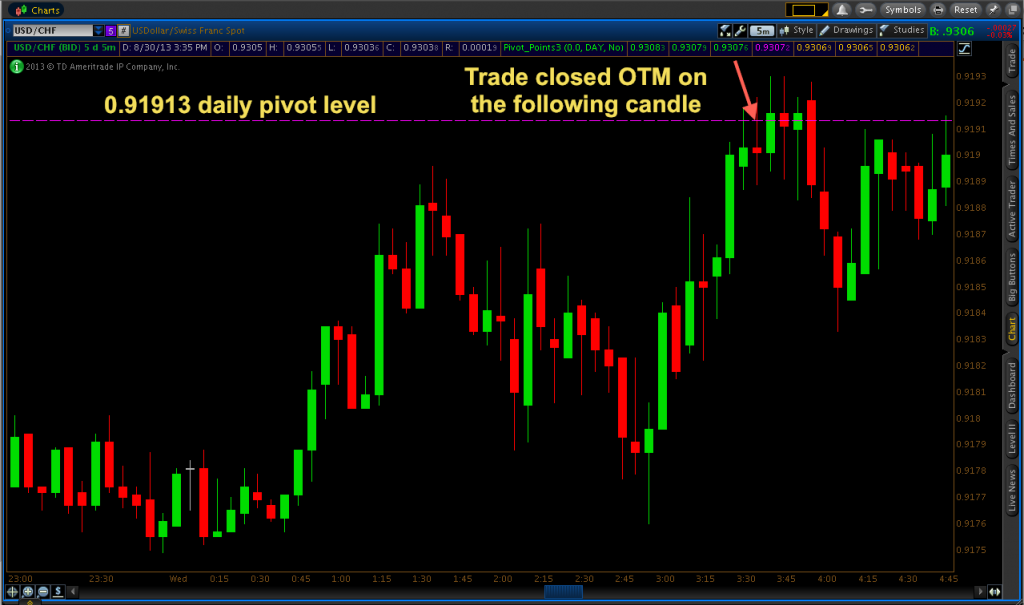
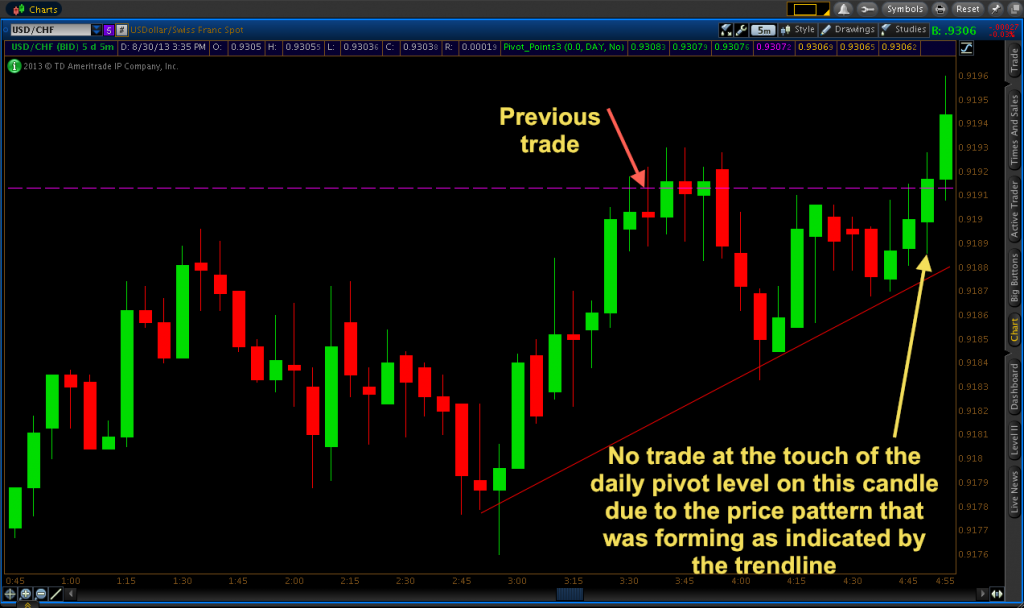
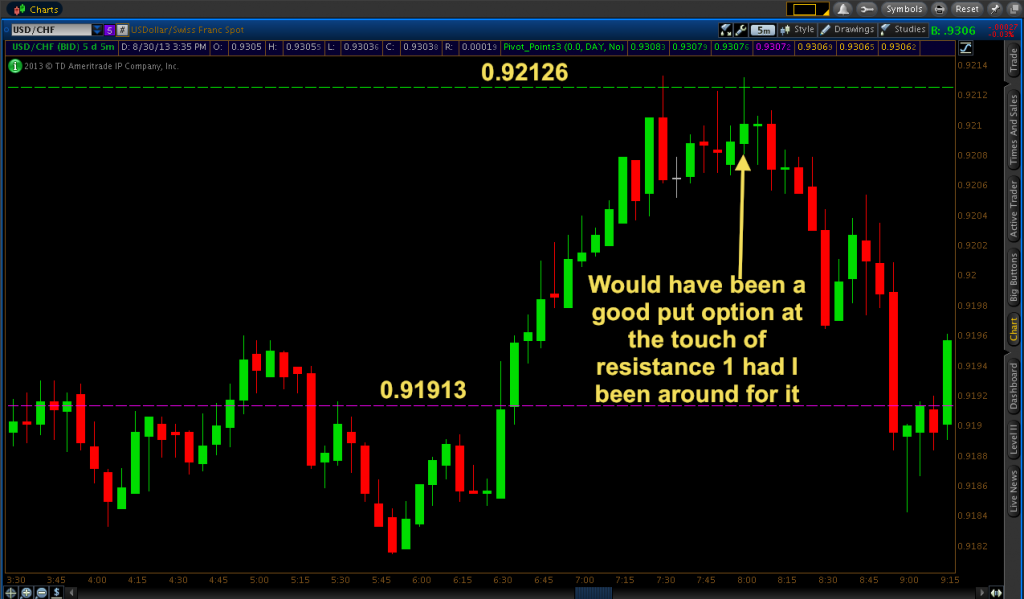
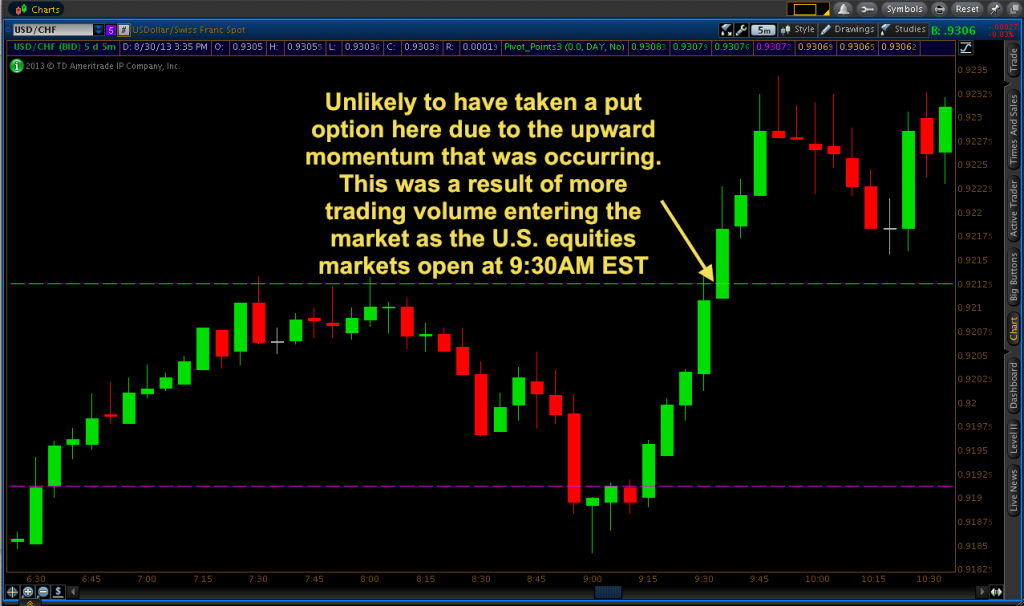
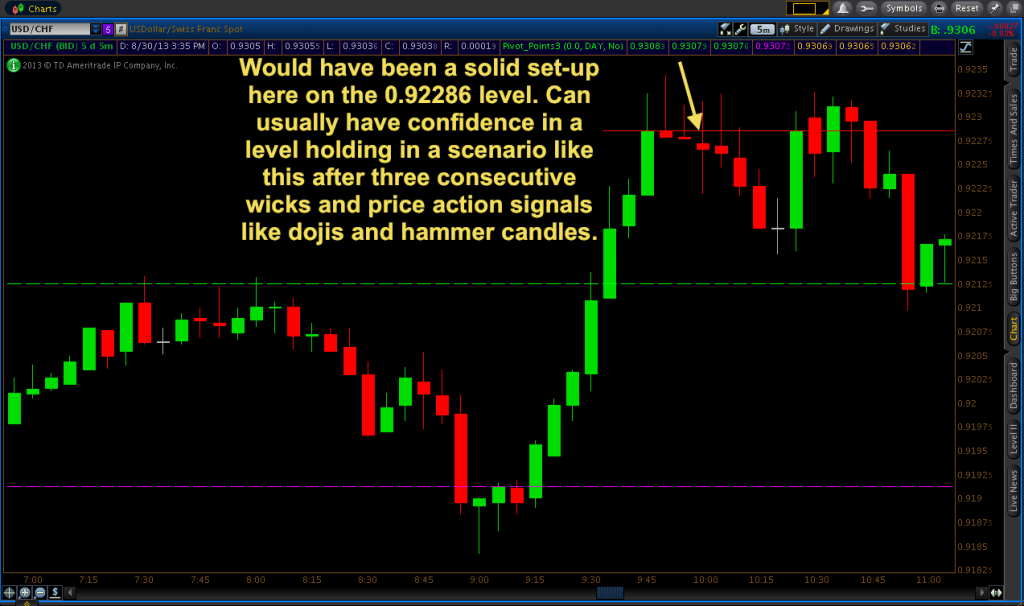
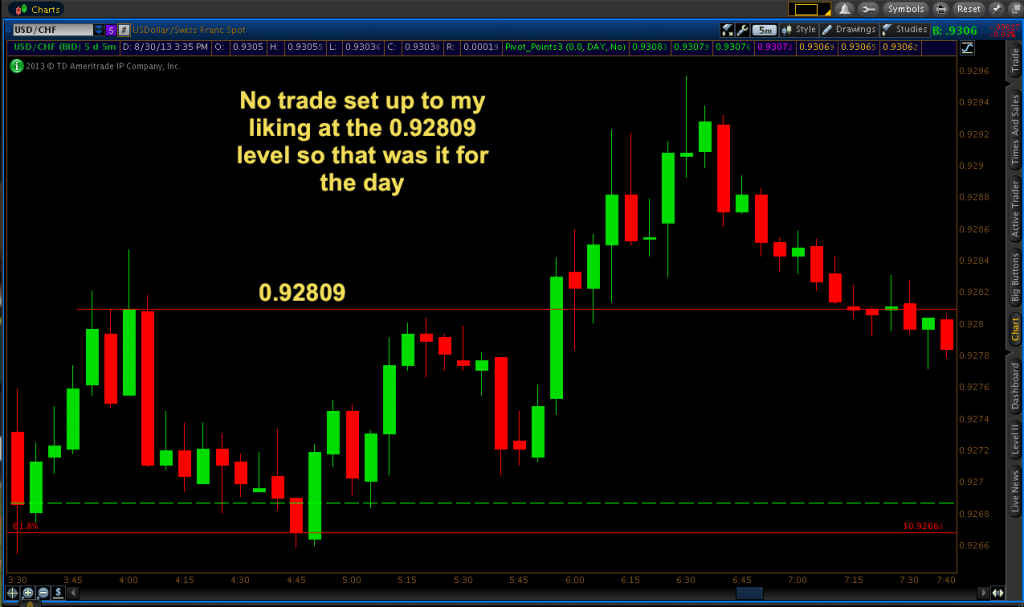
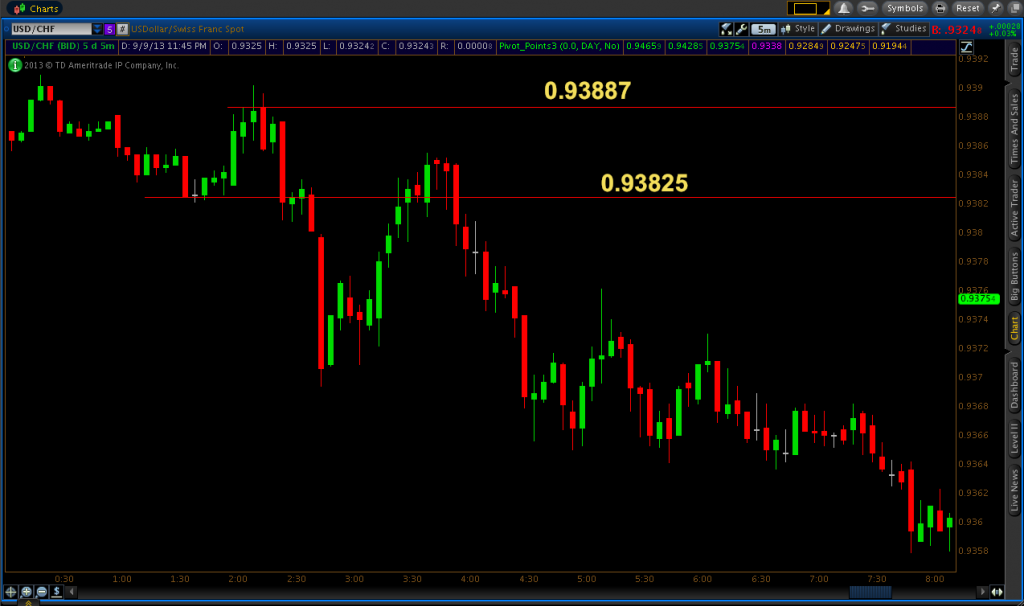
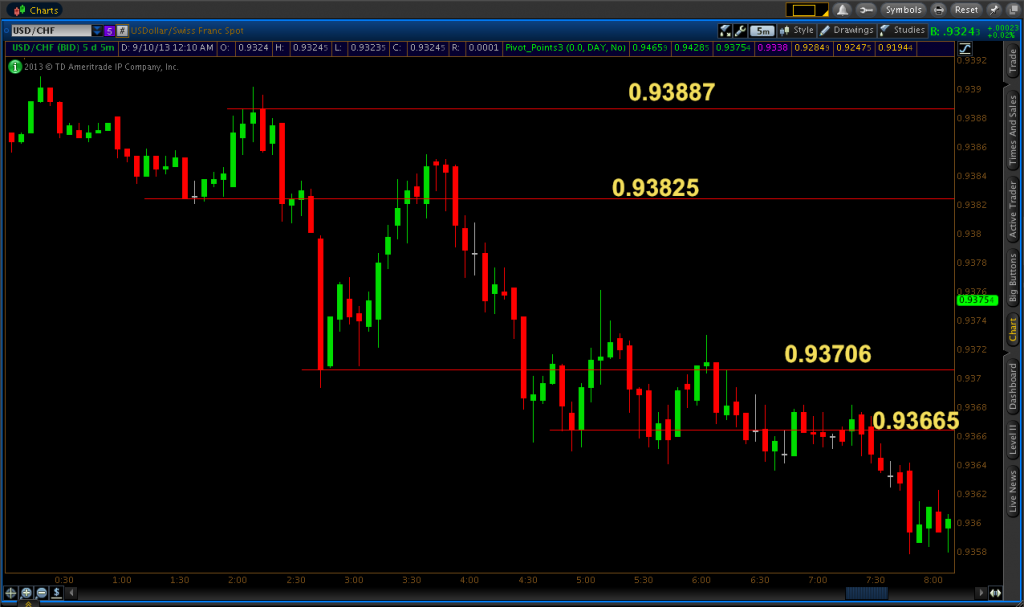
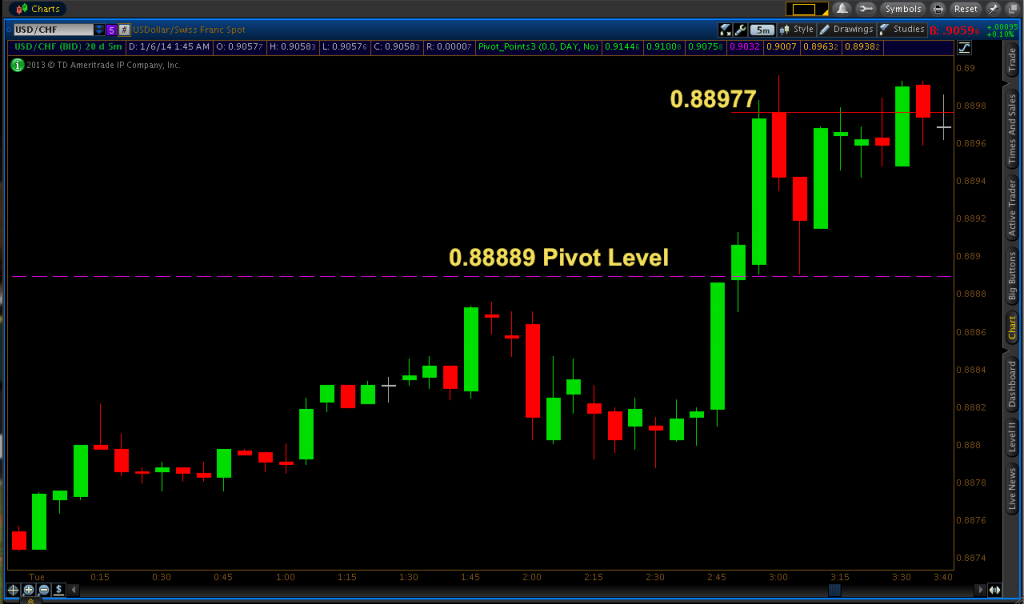
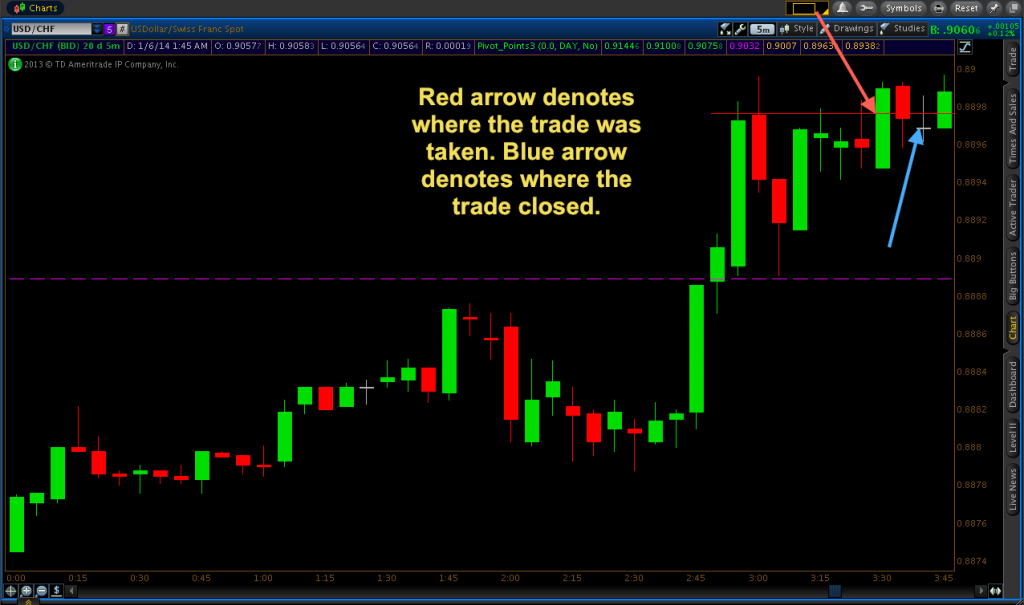
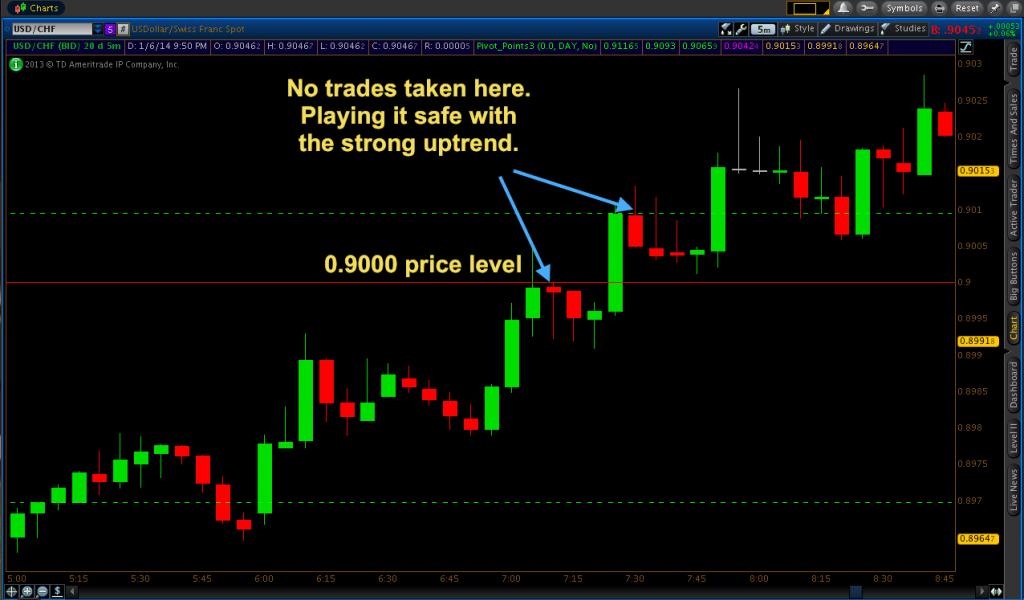
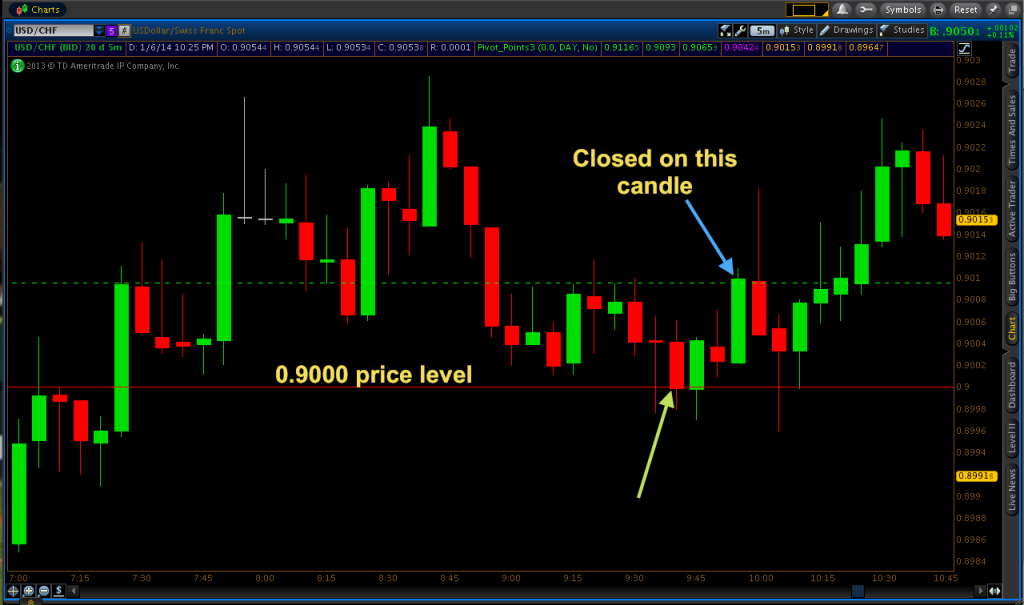
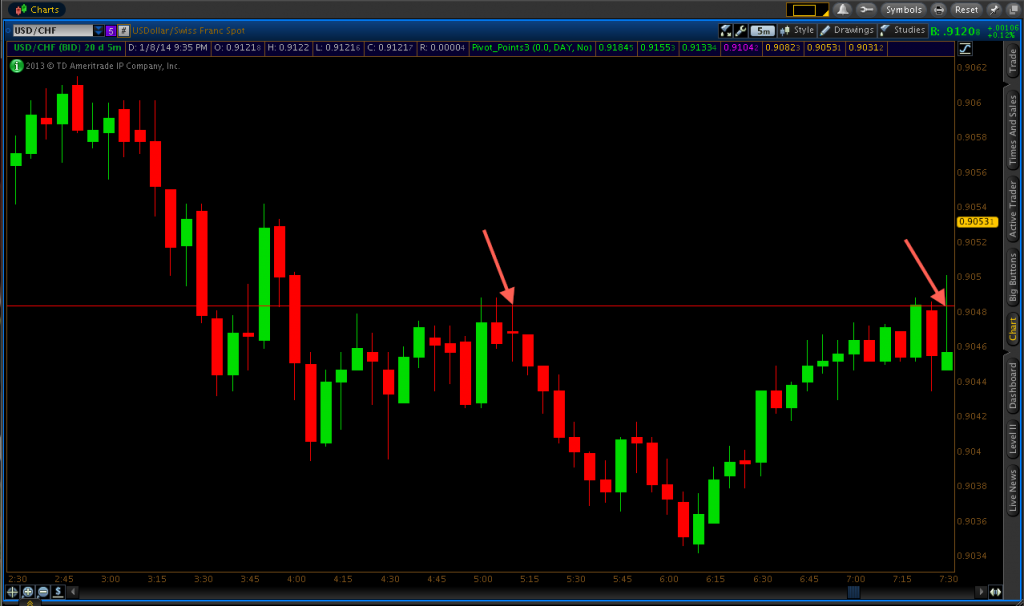
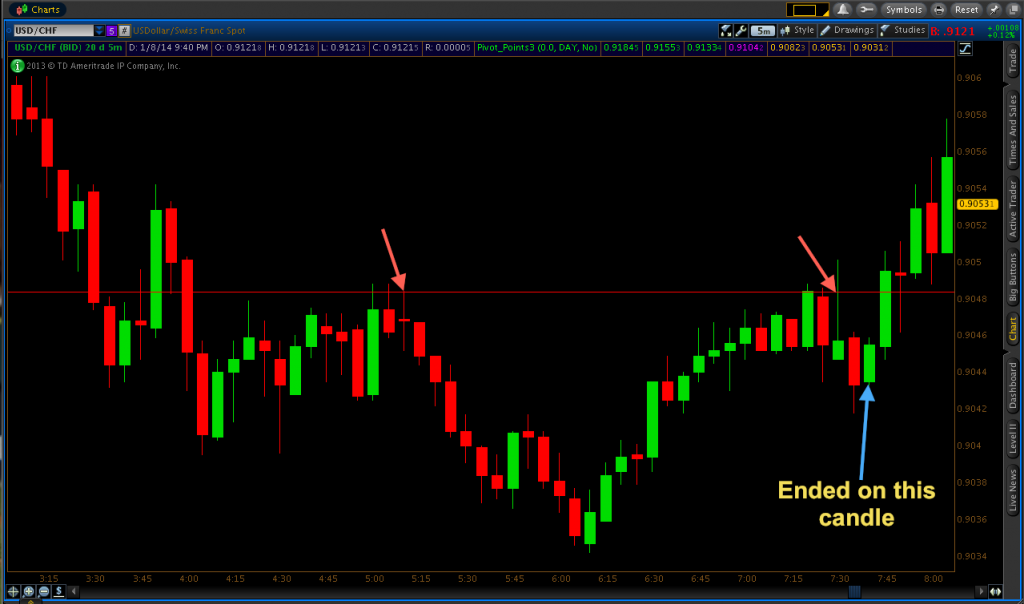
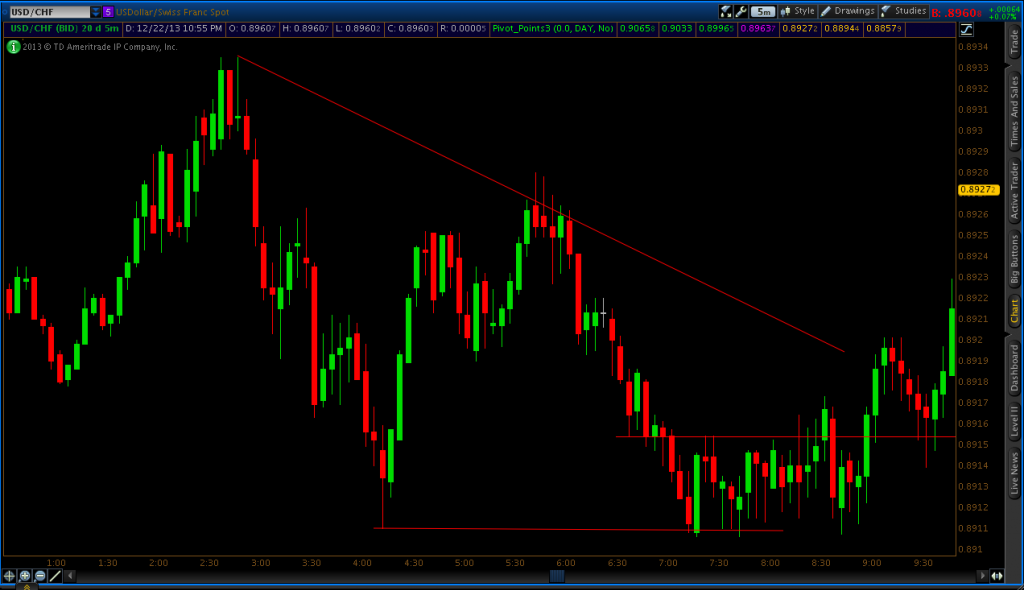
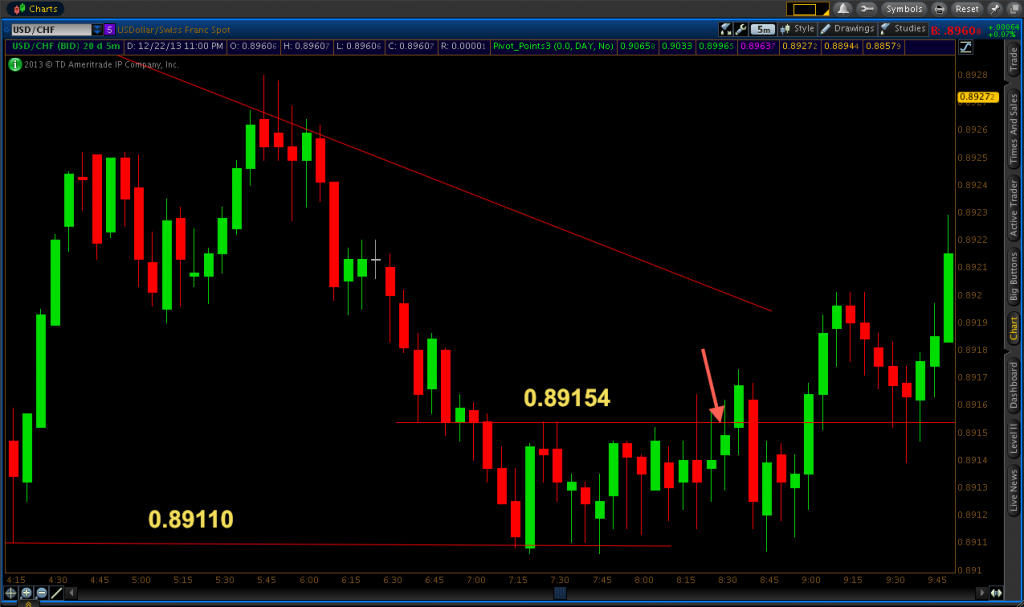
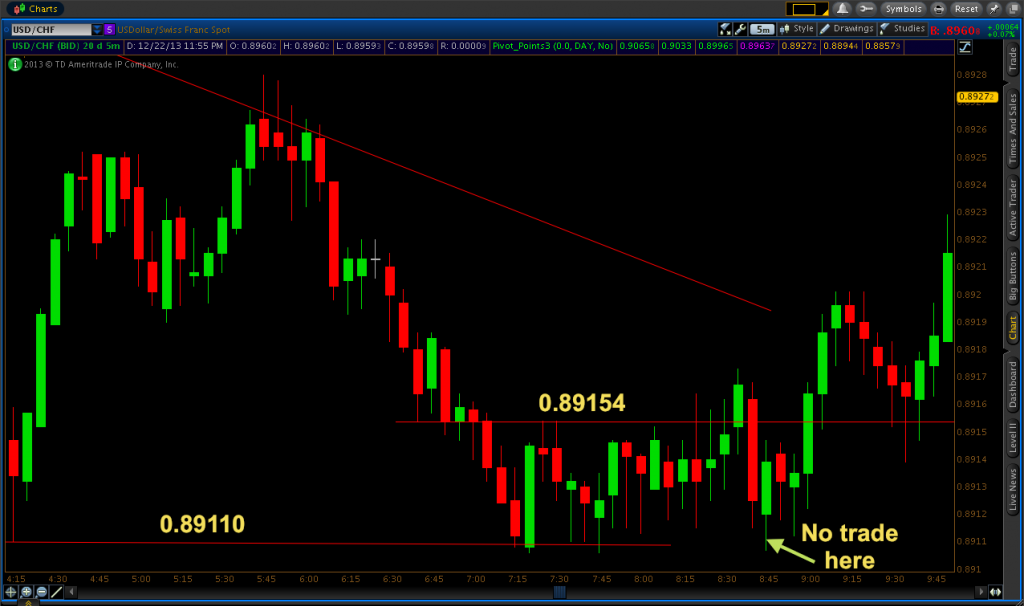
Screenshots regarding USD/CHF trading from August 21:
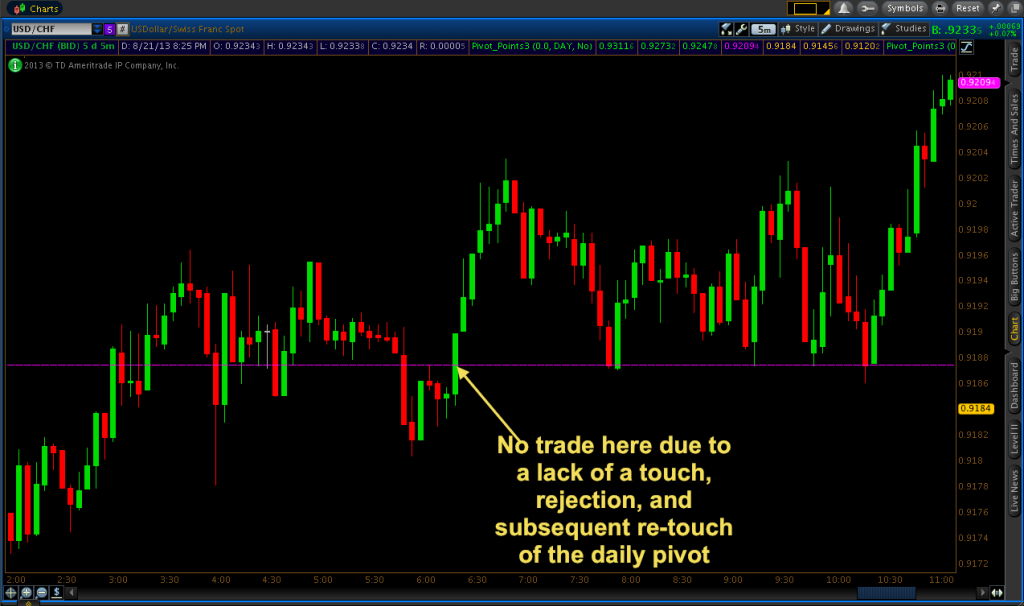
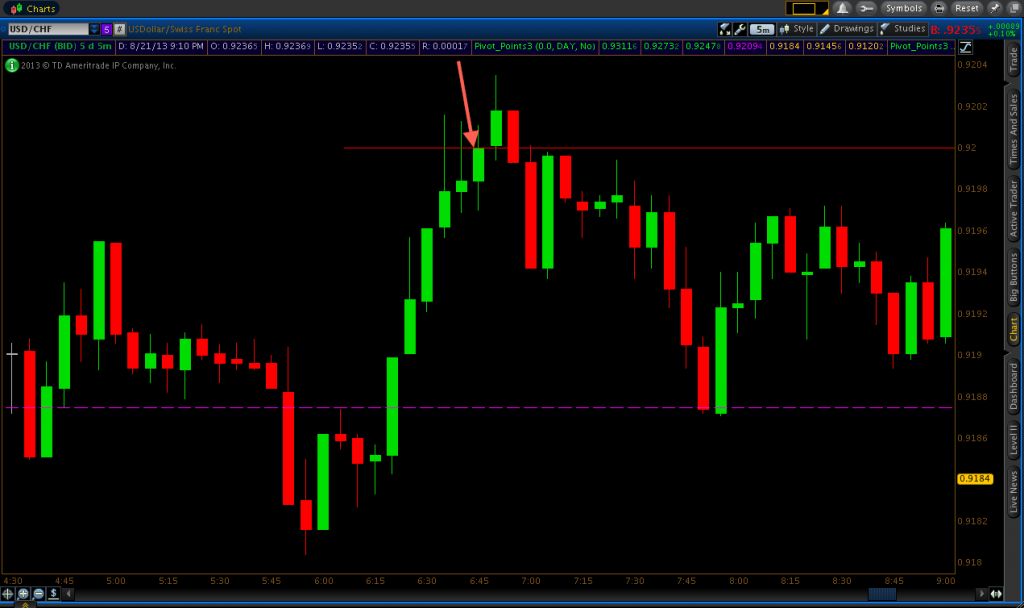
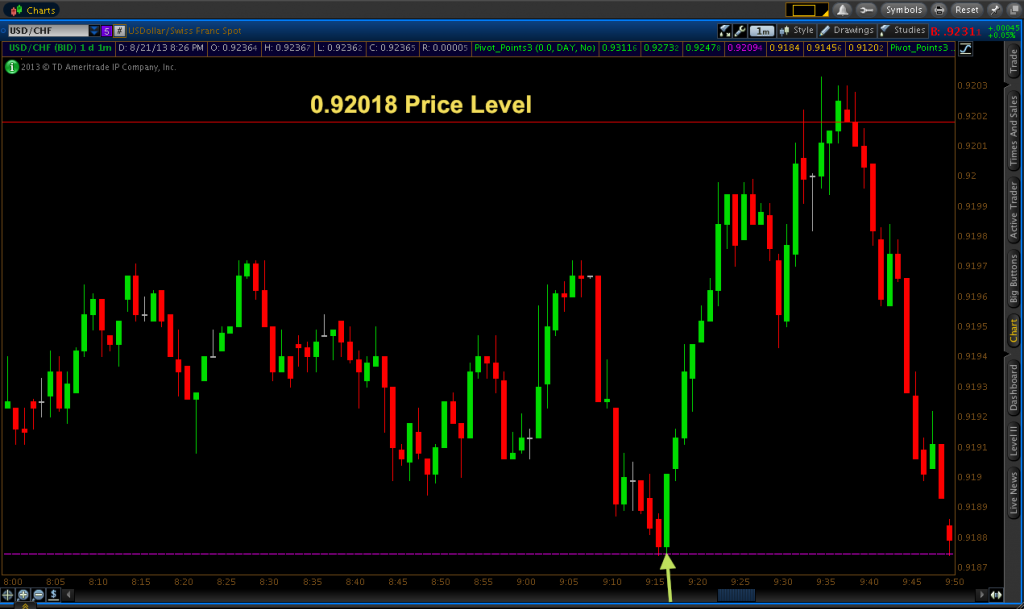

http://www.binaryoptions.net/usdchf-trading-on-stock-pair-33-itm/There was an error rendering this rich post.
-
There was an error rendering this rich post.
-
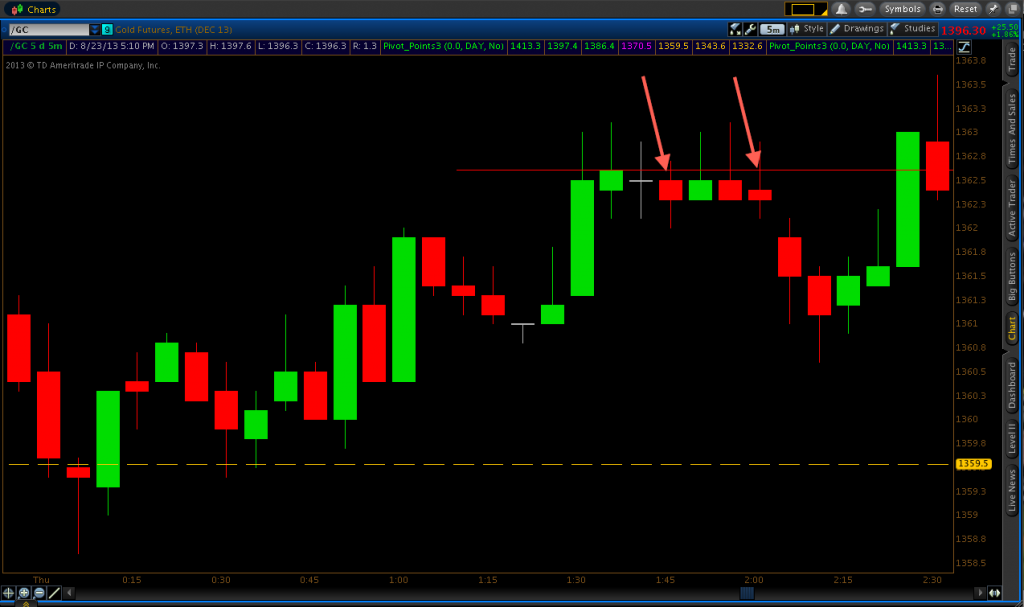
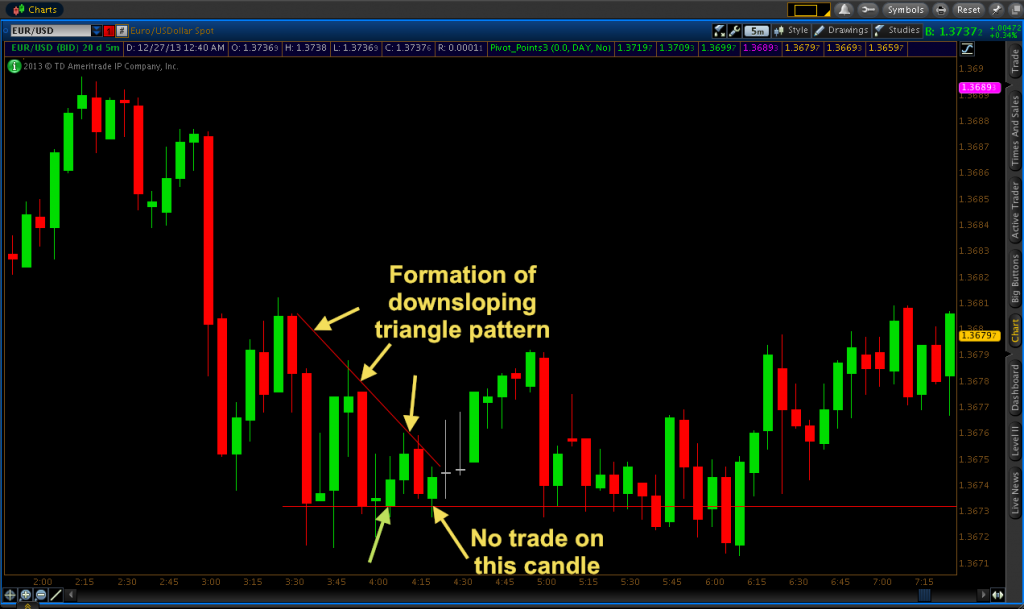
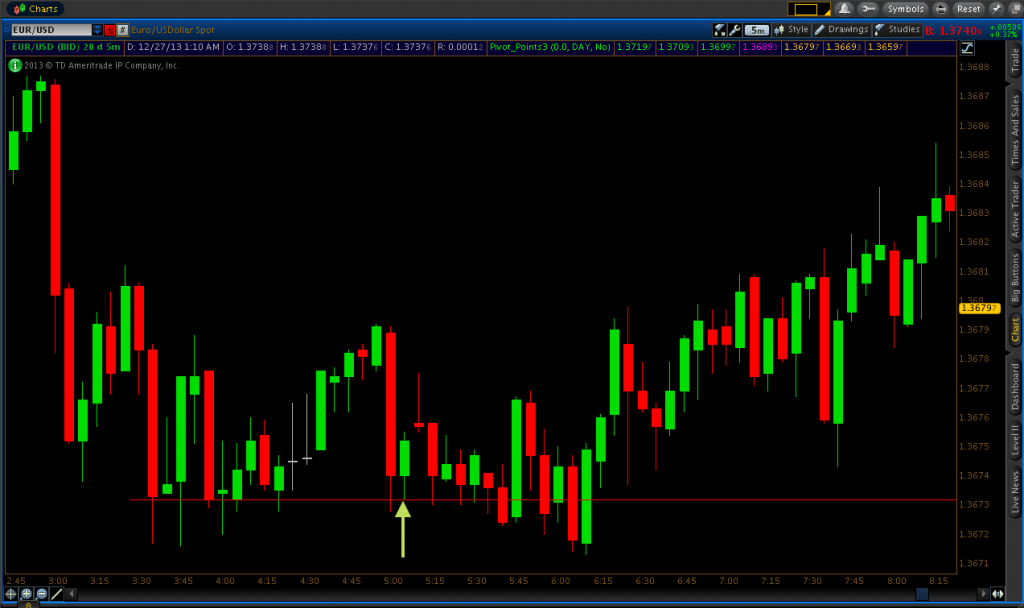
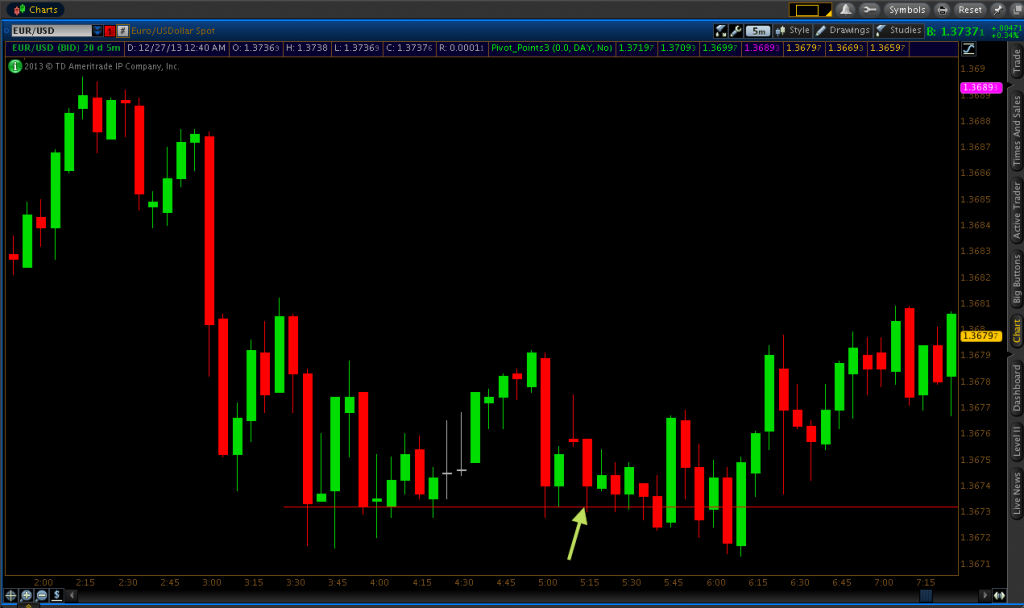
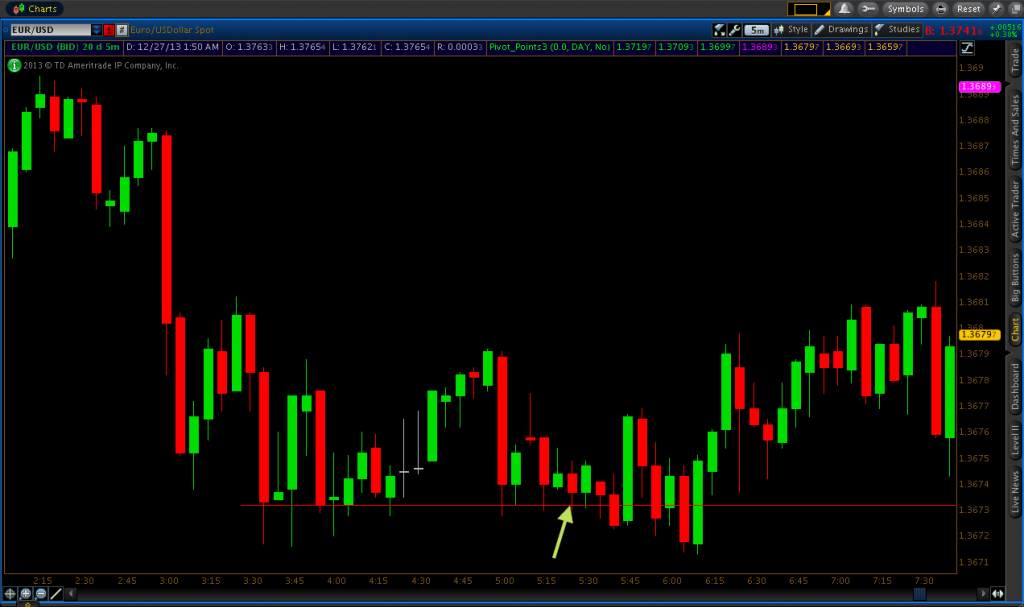
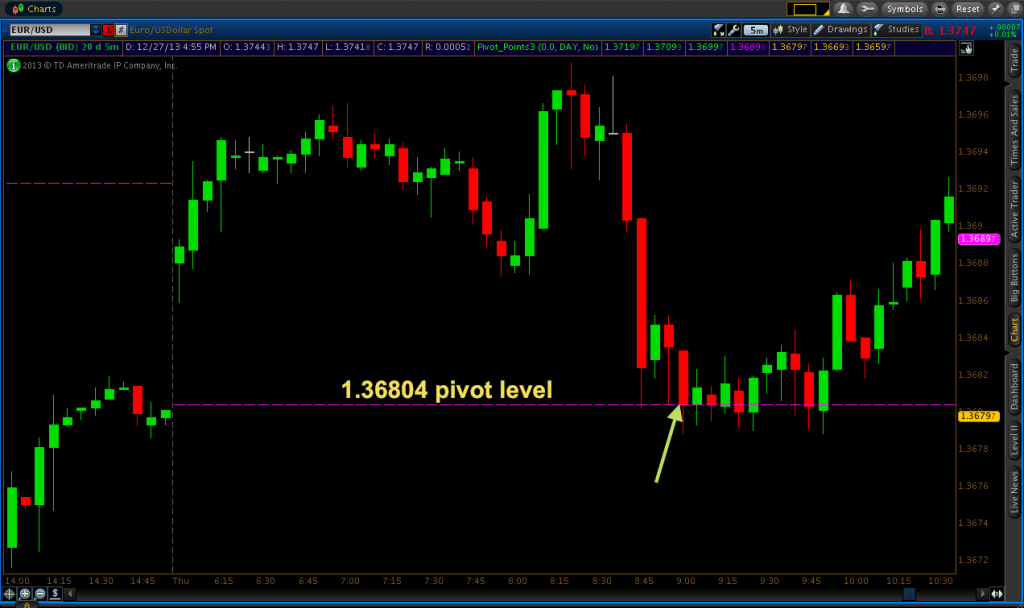
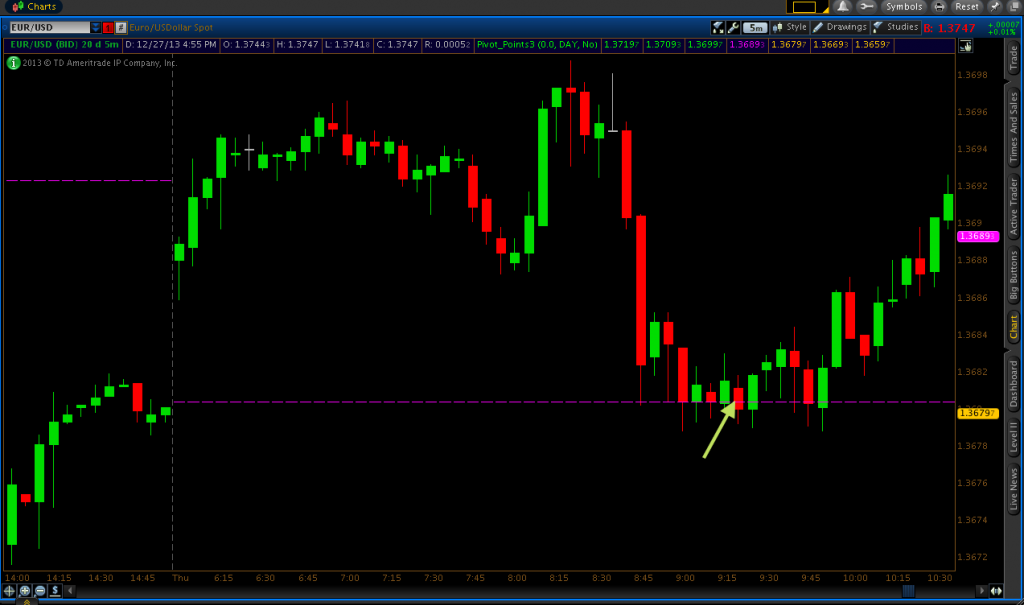
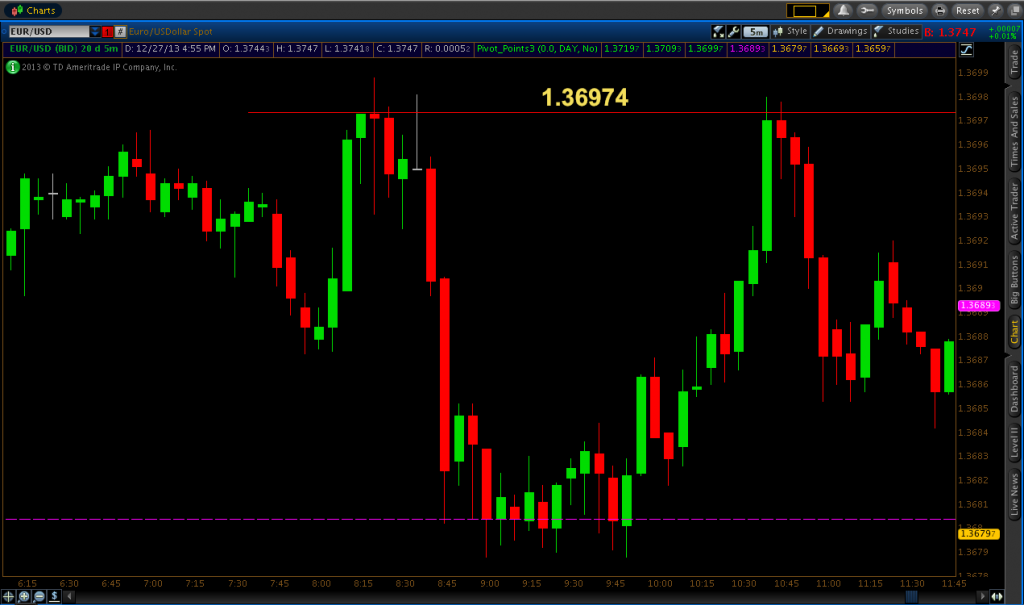
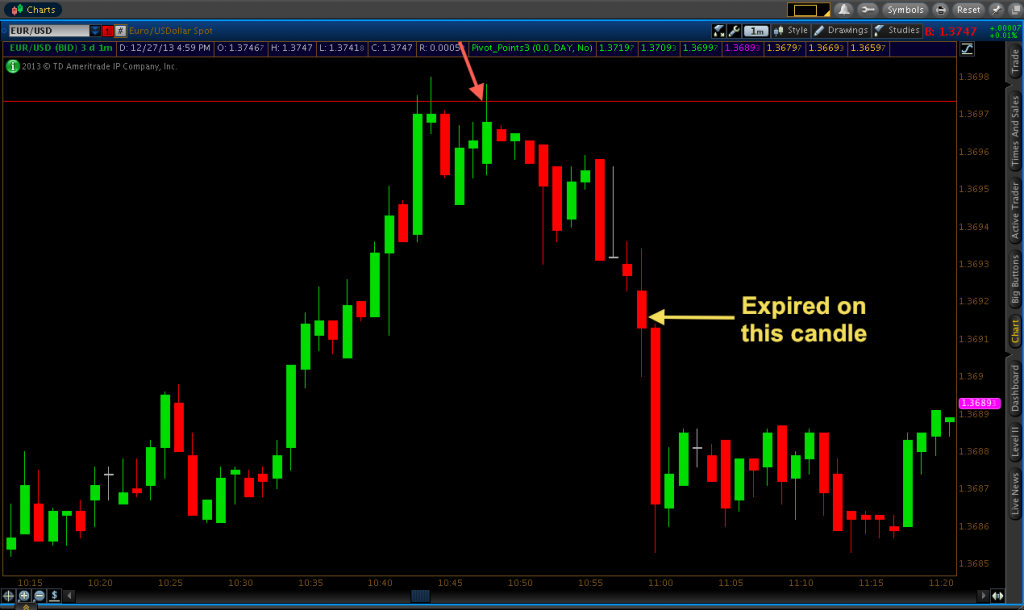
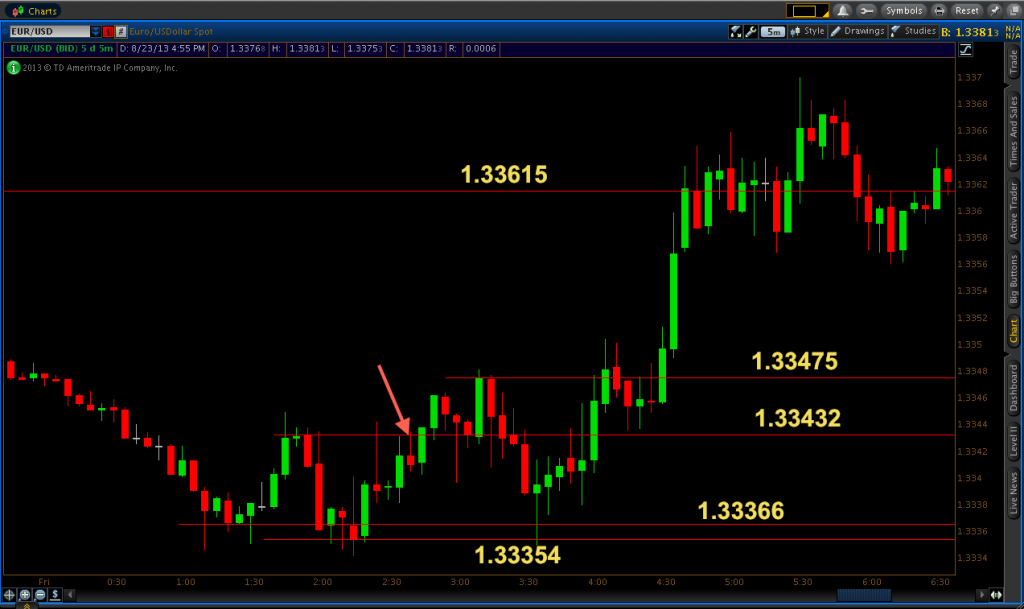
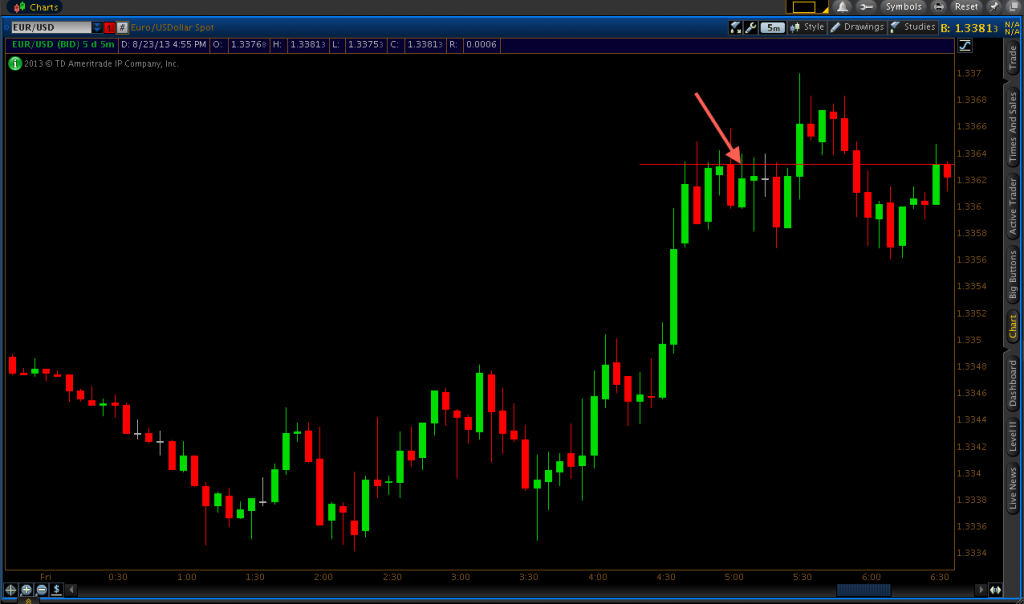
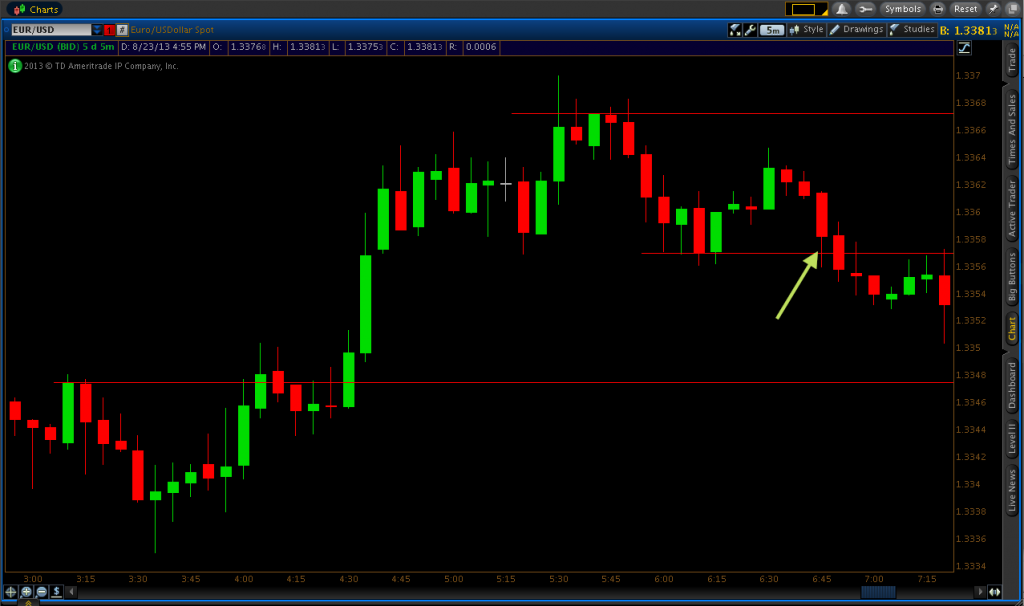
August 23, 2013: EUR/USD trading
All trades expired at the end of the next five-minute candle.
(Shows where the 1.33615 price level is derived from)

http://www.binaryoptions.net/eurusd-trading-at-markets-world/There was an error rendering this rich post.
-
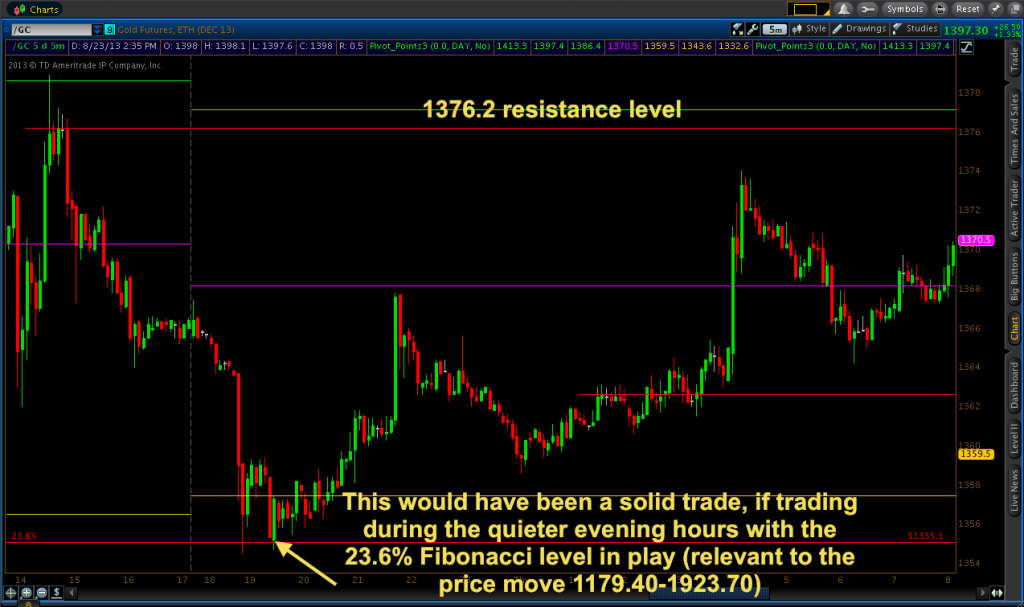
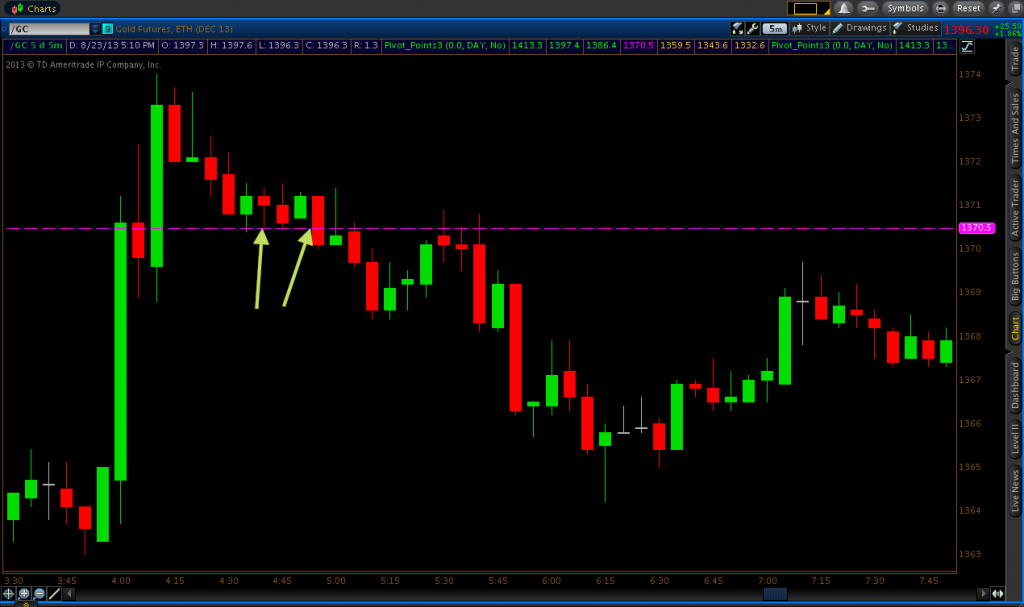
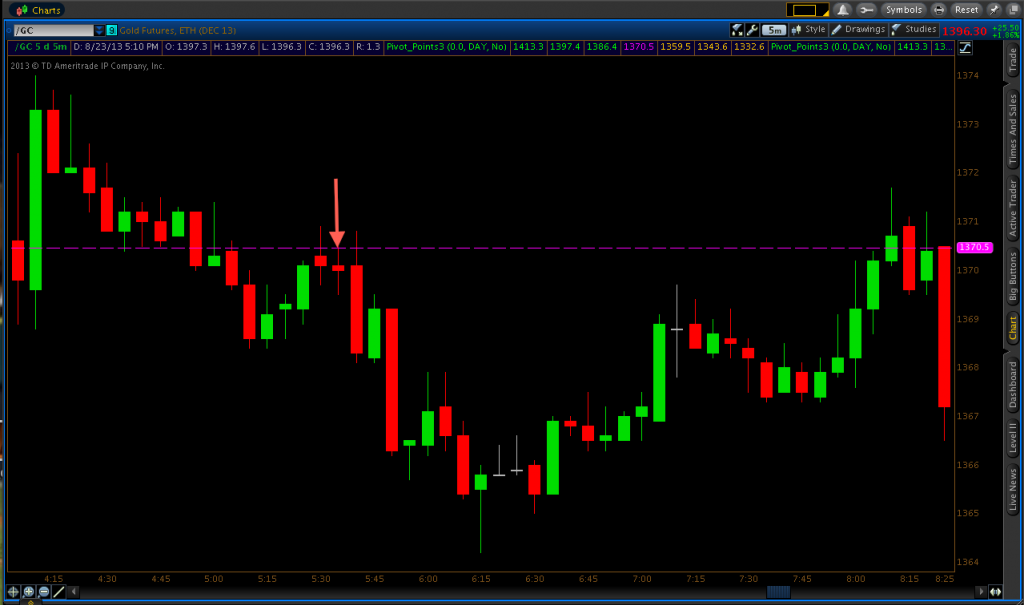
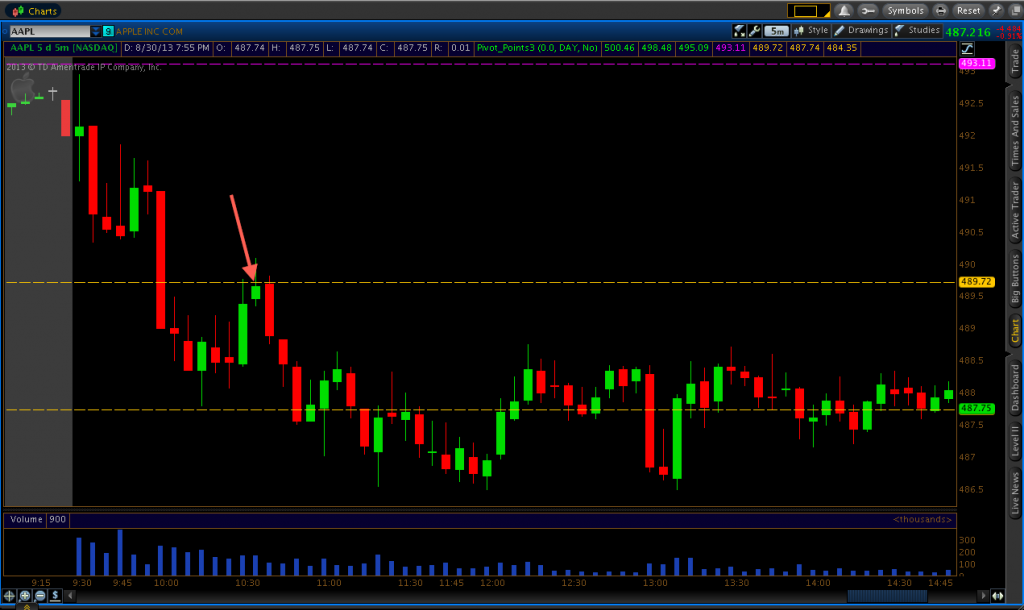
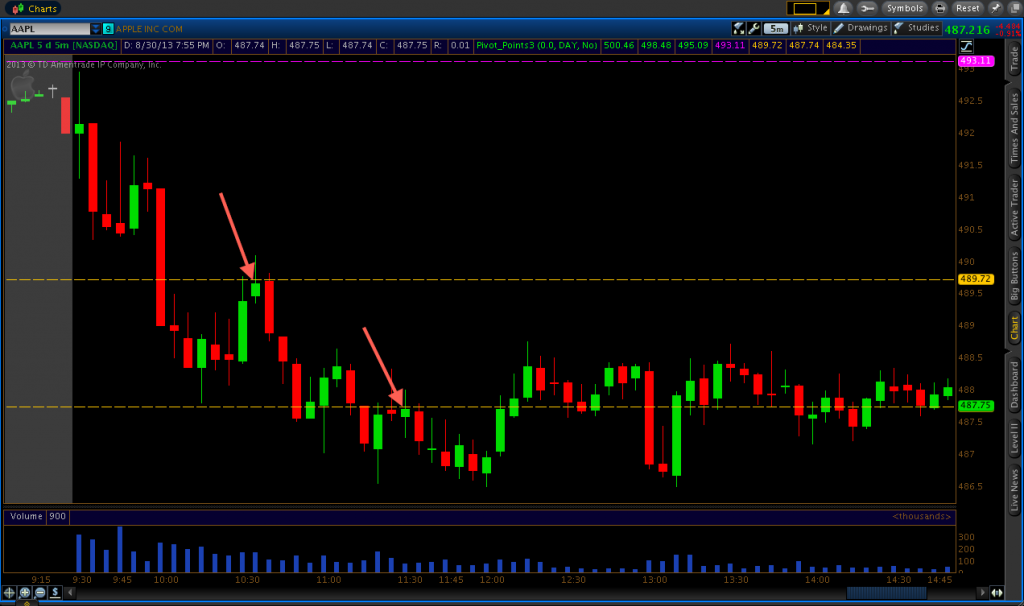
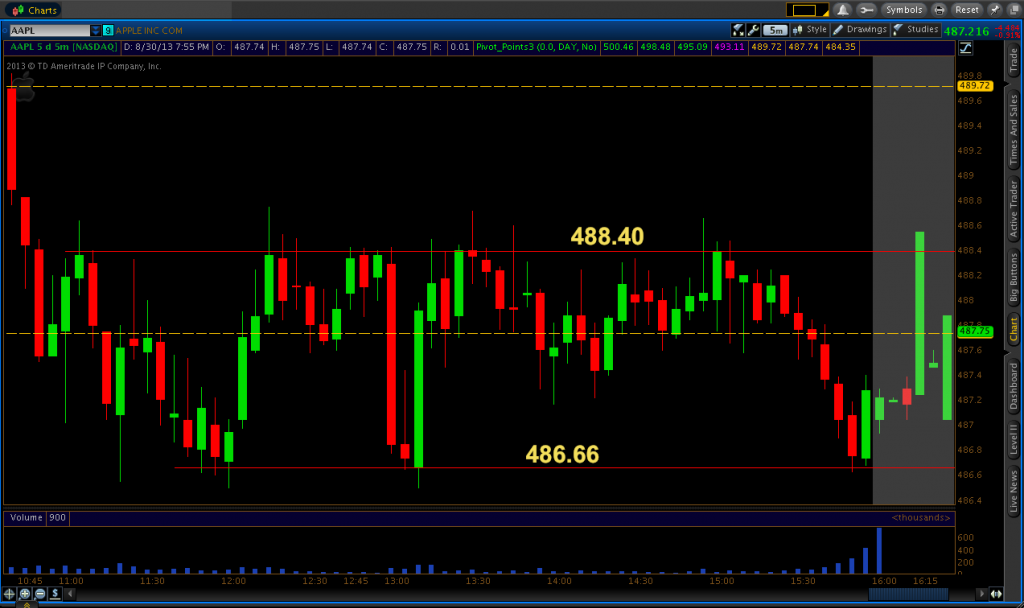
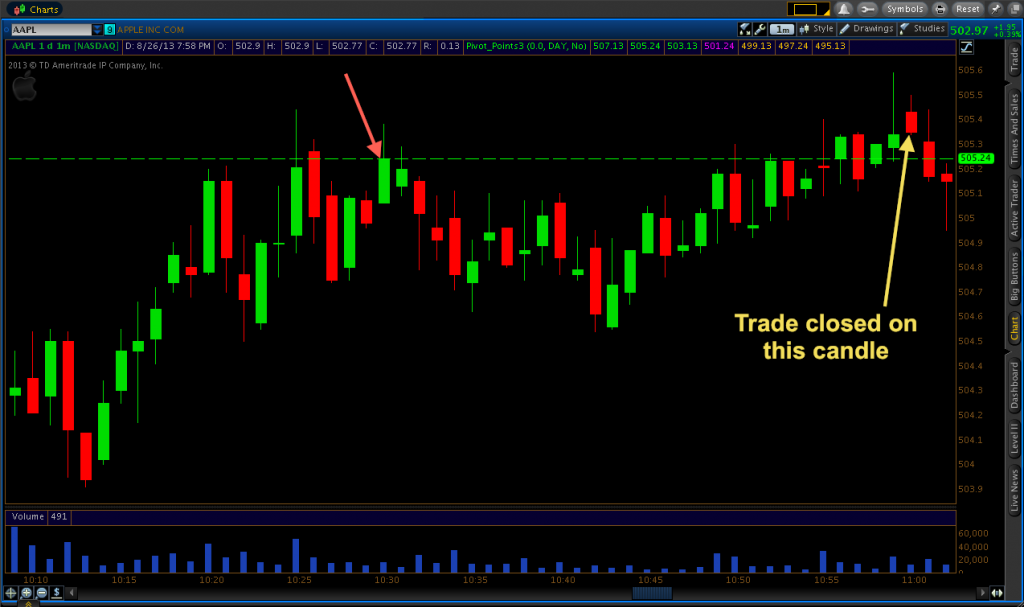
August 26, 2013
Traded equities binary options on stockpair.com. Went 1/2 ITM.
1-minute charts: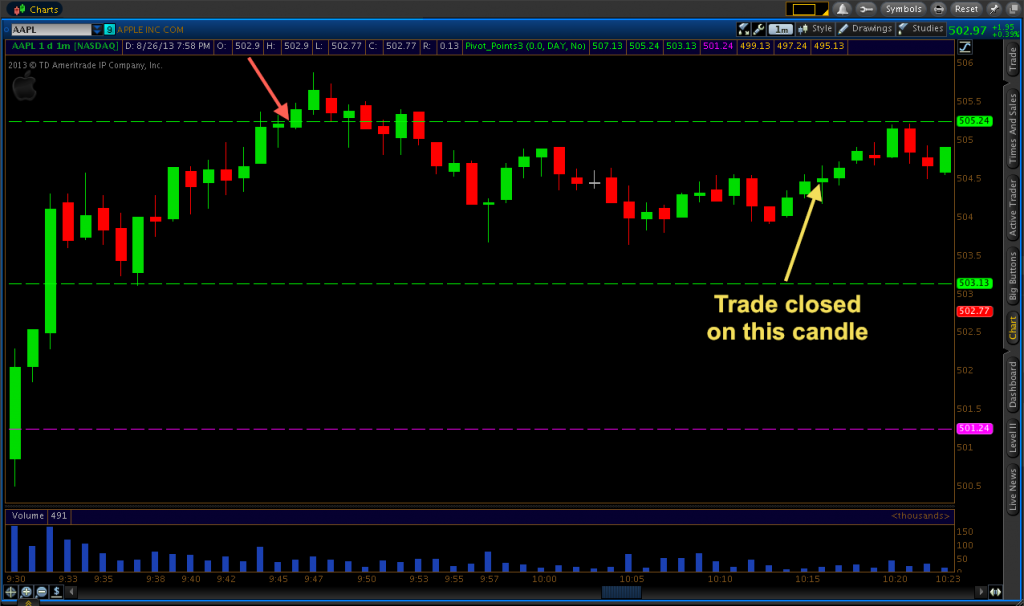
Overview from the 5-minute chart: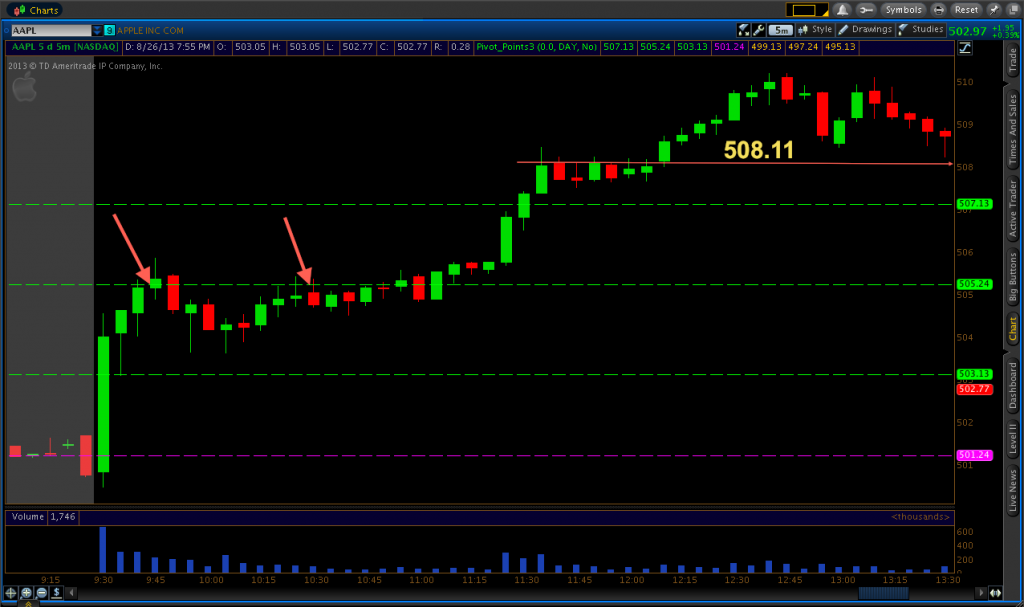
http://www.binaryoptions.net/trading-stocks-using-binary-options/There was an error rendering this rich post.
-
-
There was an error rendering this rich post.
-
There was an error rendering this rich post.
-
There was an error rendering this rich post.
-
There was an error rendering this rich post.
-
Glad to get my thread back up and running. The large screenshots are nice.
binaryoptions.net/binary-options-trading-for-october-3-and-december-9-2013/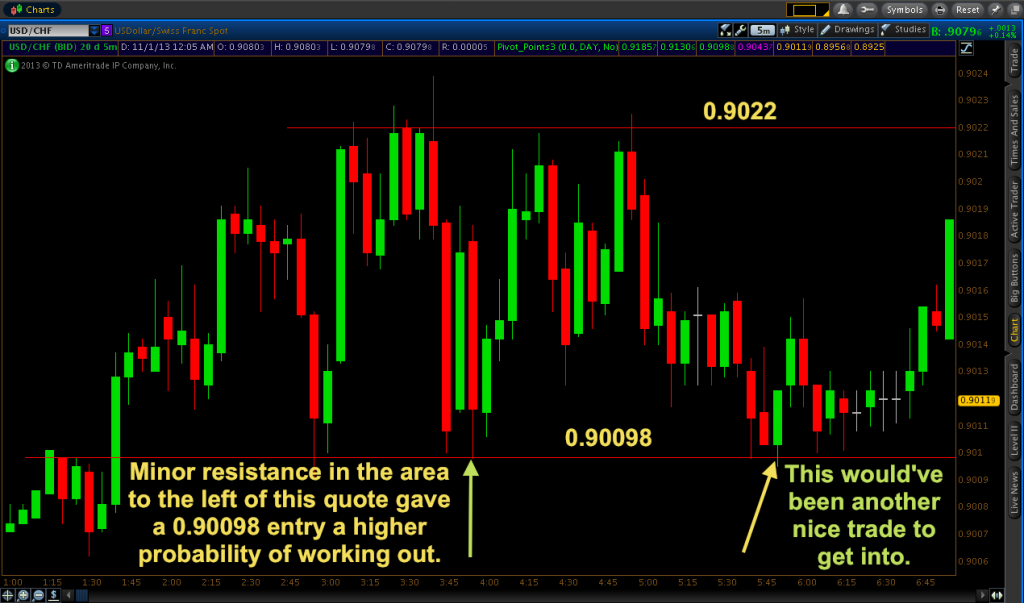
There was an error rendering this rich post.
-
There was an error rendering this rich post.
-
There was an error rendering this rich post.
-
There was an error rendering this rich post.
-
There was an error rendering this rich post.
-
There was an error rendering this rich post.
-
Hi Mifune, thank for your previous postings.
Please continue the posting, it will be good for newbie like me -
Hi Masseton,Masseton said:Hi Mifune, thank for your previous postings.
Please continue the posting, it will be good for newbie like me
I will be actively trading binaries this next week. After that, I'm not sure since I'm busy with other things eight months out of the year. But if you read through all ~80 of my blog articles, you should get a pretty good feel for how I like to trade. But I would prioritize only reading my most recent articles. Not that my articles from way back in 2012 are outdated or anything, but going through them all would be kind of like reading through a monotonous 100,000 word novel, which is pretty much what my blog has been built up into by this point.
There was an error rendering this rich post.
-
I think I will start posting my blog items to this thread -- at least the posts on actual trade strategy -- to keep it a bit more active and perhaps make the articles more accessible:
Back with a Bit of Trading on the EUR/USD
December 29, 2014
I took the following trade on December 26, 2014. I simply went with both the intraday and longer-term trend on the EUR/USD – markedly southward – in the form of a put option. Price had reached down to around the 1.21695 level by breaching the support 1 level and coming back up to it. I disqualified support 1 as a viable support or resistance level on which to base a trade, as price didn't show any sensitivity to it.
Like I enjoy emphasizing in my posts, you never simply trade a price level even if support and resistance is your primary way to mentally organize a chart (as it is for me). I know it can be tough if you've been immersed in some boring market for hours on end (as it is around Christmas and New Year's) and you're dying to take a trade as soon as price touches down to a support or resistance level on your chart. That won't be an effective way to trade the markets. You need multiple factors going in your favor to support some belief of where the market will go in the future. For me this means not simply taking random entries with the trend no matter how strong it is, or trading a support level or daily pivot point just because it's there, and taking a trade on the basis of the shape of a certain candlestick because it might be a prototypical textbook example of a bearish or bullish price action indication.
Once price got up to the 1.2181 level, a line of resistance began to form. While 1.2181 doesn't actually represent where any single candle body opened or closed on this particular congestion string, I looked at this level as a fairly safe potential put option entry point. If only for the sake of being conservative as a I naturally tend to be.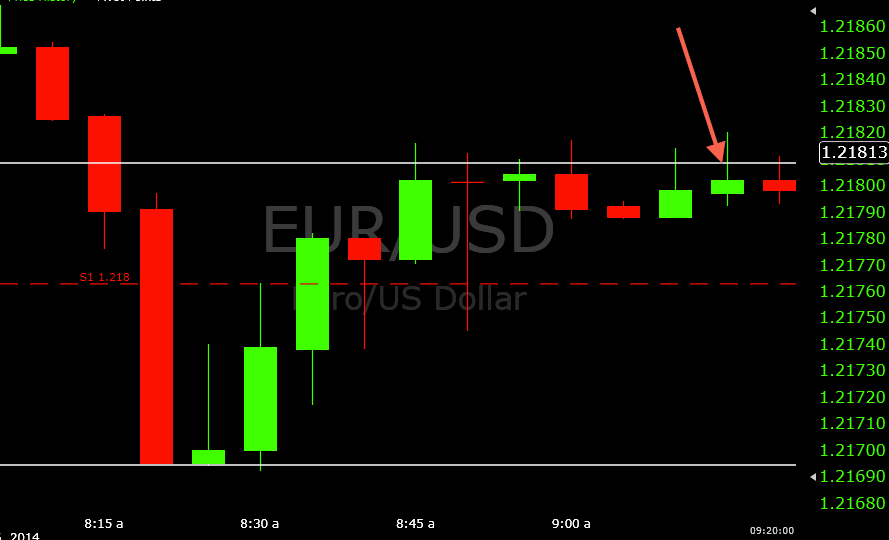
After the 9:00AM (relative to Eastern Standard Time) candle, four consecutive candles were lined up on this area to form a technically weak area of resistance. But once it rejected the level again on the 9:10 candle, I was content to take a put option on the 9:15. In my experience, these types of trades do tend to work out most of the time. When there's a half-hour period of congestion, the more typically market outcome is a reversal back in the direction it came from before the consolidation. I wouldn't be able to put a certain percentage on it, of course, but in terms of a general price action model, this can be a very winnable trade setup in many cases. Each market scenario will be different, so as always it's essential to exercise prudence and not simply trade every congestion pattern that sets up in the direction it originated.
This turned out to be kind of an interesting trade given my entry point nicely acted as a point of resistance. It would go in-the-money for a period, then go out-of-the-money to less of an extent. In the end, I won by 1.5 pips. The actual fall off from 1.2181 didn't occur until after the trade's 9:30 expiry.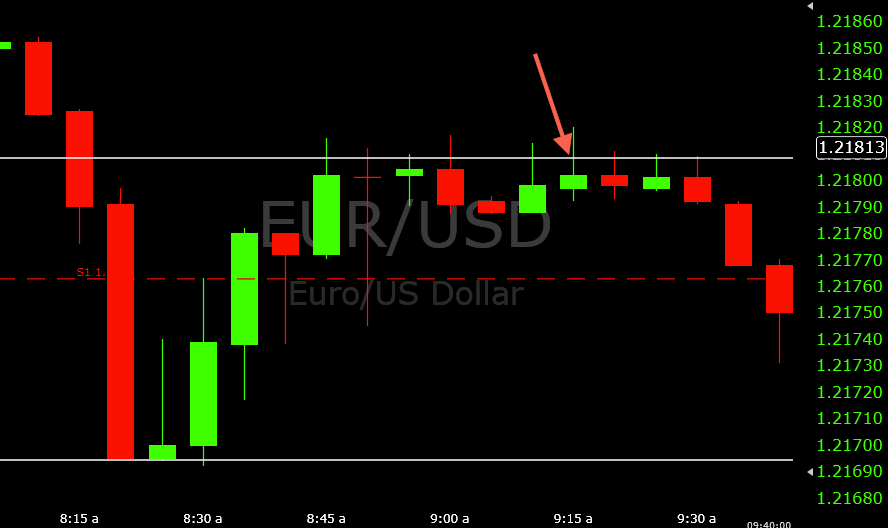
A more zoomed out view of the context in which this trade was taken: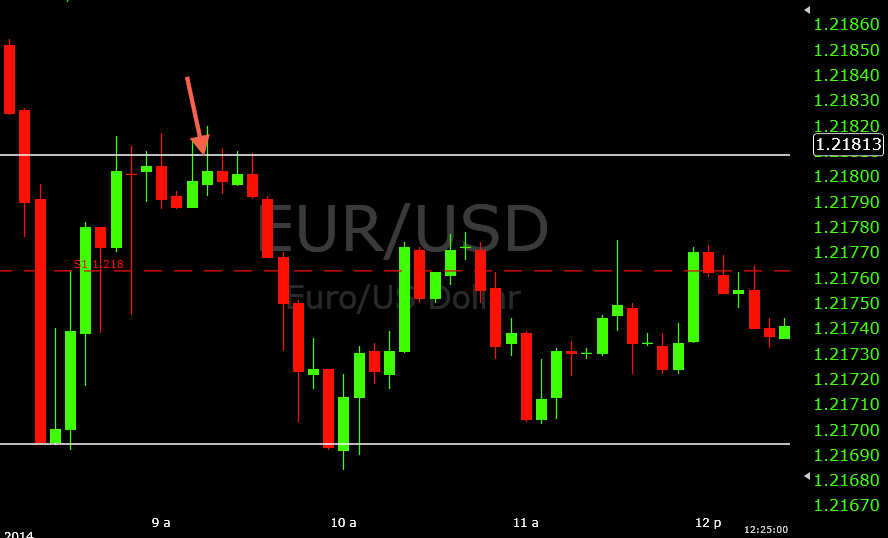
Please let me know if you have questions or comments!There was an error rendering this rich post.
-
Gauging Progress and Trend Trading
December 29, 2014
For binary options, I always look at my win percentage to gauge my progress over various intervals – e.g., week, two weeks, month, past 25 trades, something of that nature. If my in-the-money percentage is sufficiently high, 60% is a threshold I like to use, then the profit has no choice but to come.
In my time away, I scarcely even look at charts. I simply decide that I'll catch up on what's occurring after I have the actual free time available to trade. The EUR/USD is my favorite asset to trade and tends to offer pretty decent returns on whatever broker one happens to use. I was aware that it was still in a general downtrend, but I was quite surprised to see it potentially closing in around the 1.2000 level.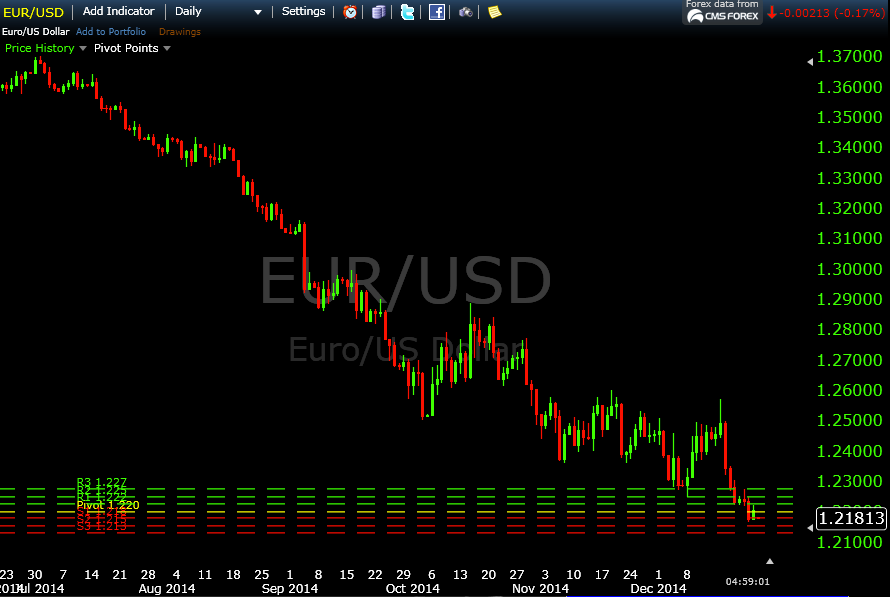
This pair has simply been bleeding ever since July. If one had sold this pair around this time in a spot forex trade (1.3600-1.3700 level), that would be a nice 1400-1600 pips of profit in merely five months. October – when volume really ratchets up after relatively sluggish summer trading – was pretty even. But even between October and December, this pair fell 600 pips. Despite clear observance of congestion, support continues to be broken.
One of the biggest sources of confusion in trading is what exactly constitutes a trend? Every market situation is different, so there are natural variations in the extent of a trend, how the trend changes based on the extent of the price history considered (e.g., The past couple hours? Day? Month? Year? Multiple years?), how it varies by charting timeframe, and most importantly, how and whether one should use this information to guide trading decisions.
While I typically do not place a ton of emphasis of following longer-term trends when making sub-15-minute binary trades, I will admit that in a falling market I do feel most confident taking put options. For instance, for anyone who takes short-term oil trades of any form, over these past few months the best approach has by and large been short trades/put options. If a market is falling on, say, 70% of its days in the recent macroscopic, multi-month trend, then this effect will bleed down to the short-term nature of the intraday trades being taken.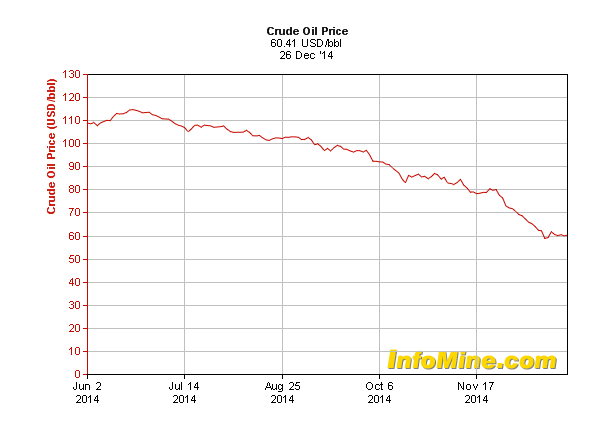
I tend to focus on the actual intraday leanings of a market itself when determining “trend,” but considerations of longer-term behavior that can be found on the higher time compressions (e.g., five-minute chart) have some level of necessary relevance as well. It might seem complicated and confusing considering short-term trends and also longer-term trends in the context of an actual strategy, but it really shouldn't be. In fact, I find my own trading approach very simple. Just price action -- as in observing candlestick behavior as shown by candle lengths, wicks, and looking at what it's doing in real time -- support and resistance levels, and considerations of trend when perhaps determining a certain inclination to trade in one direction or the other.There was an error rendering this rich post.