Dimensional Support & Reistance (DSR) Examples

BinaryProCharts
Posts: 3 ✭
I'll jump right in! For a little back ground take a peek at my introduction. Dimensional Support & Resistance is a modified drawing tool we have
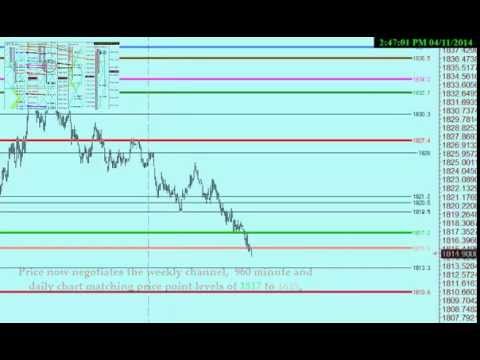
worked on and traded with for many years now. Dimensional Support & Resistance bypasses traditional horizontal support & resistance and instead
illustrates support & resistance using vectors, angles, intersections, and channels, we then combine multiple time frames and look for Dimensional
Support & Resistance price match ups. One important consideration to understand this is not a lagging tool, and can work in confirming signals moving
average based indicators put off. I'll use Friday April 11 2014 S&P 500 as an introductory example, My partner (hopefully wife to be) Ne' and I do a
lot of time stamped video recording and images. We use our analysis in our own trade decision making process, we primarily Trade YM, ES, & EUR/USD.
Renee and I understand there is a functional correlation to intra day & weekly price movement and Binary Options. Ultimately we feel our tool can
greatly assist any class of trader including Binary Option traders in the decision and trade management process. One of our hopes in participating in
this community is to gain feedback on the application and usefulness of DSR to a Binary Option Trader and a better working knowledge of the
challenges you face.
 http://youtu.be/pxy4ddglmjY
worked on and traded with for many years now. Dimensional Support & Resistance bypasses traditional horizontal support & resistance and instead
illustrates support & resistance using vectors, angles, intersections, and channels, we then combine multiple time frames and look for Dimensional
Support & Resistance price match ups. One important consideration to understand this is not a lagging tool, and can work in confirming signals moving
average based indicators put off. I'll use Friday April 11 2014 S&P 500 as an introductory example, My partner (hopefully wife to be) Ne' and I do a
lot of time stamped video recording and images. We use our analysis in our own trade decision making process, we primarily Trade YM, ES, & EUR/USD.
Renee and I understand there is a functional correlation to intra day & weekly price movement and Binary Options. Ultimately we feel our tool can
greatly assist any class of trader including Binary Option traders in the decision and trade management process. One of our hopes in participating in
this community is to gain feedback on the application and usefulness of DSR to a Binary Option Trader and a better working knowledge of the
challenges you face.
http://youtu.be/pxy4ddglmjY Comments
-
Please use one thread and update it as much as you like do understand all I see is pyrapoint mixed with S/R so meh... By the way you and your proprietary system looks like garbage to me and you sound like Cynthia who makes crap systems to sell to n00bs because she really can't trade herself. *gets popcorn - Alas I will allow this because you have not broken any rules just please keep it to one thread thanks
-
I apologize that your offended. You are correct DSR is a hybrid modification of several drawing tools & there parameters, that when applied to multiple time frames identifies highly probable points of support and resistance, as well a the potential to define areas of congestion/consolidation,these would be represented by the non colored lines which represent a channel or intersection, but not a time frame match up. I hope I was clear in my introduction here. I have traded for many many years, I'm winding it down and as you know I have a site I'm playing with. I'm not here to solicit, but to share and get a better understanding of the challenges BO traders face. An opportunity came up this afternoon to video an interesting scenario last 53 minutes of SPX condenced to about 3 minutes, I would really appreciate it if you watched it, we all have something to bring to the table.
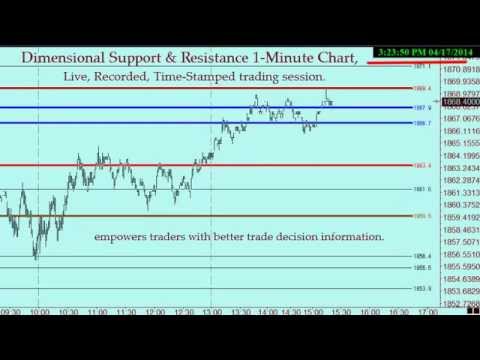 http://youtu.be/_CPk8bBBdss
 -
I am a professional trader I am not a n00b. Indicators on charts don't excite me. As far as I am concerned you are just a marketer as I remember Cynthia being with her selling systems to n00bs. Hey if you are now BANGing her at least she is getting ___ed instead of her ___ing everybody else. You can share the trading analysis all you like in ONE THREAD = you just post to this thread not a new thread every time you post. I don't want 20 different posts in one thread with each day added, its straight up retarded.. See how I posted in this thread and your DSR Examples comes up on the main page. Its friggin magic!